Trip Viewer⚓︎
The Trip Viewer provides you with convenient access to your fleet’s trip data. You can use the list view to easily find trips during which important events, such as crashes, were created, view detailed data, and share trips with your coworkers. Use the map view for prepared visualized trip data and to gain insights into your fleet units’ usage. The Trip Viewer is located under Analytics > Trips.
Info
Trip Viewer and its features are a purchable extension to FleetControl. You can purchase it by reaching out to your INVERS contact person.
List view⚓︎
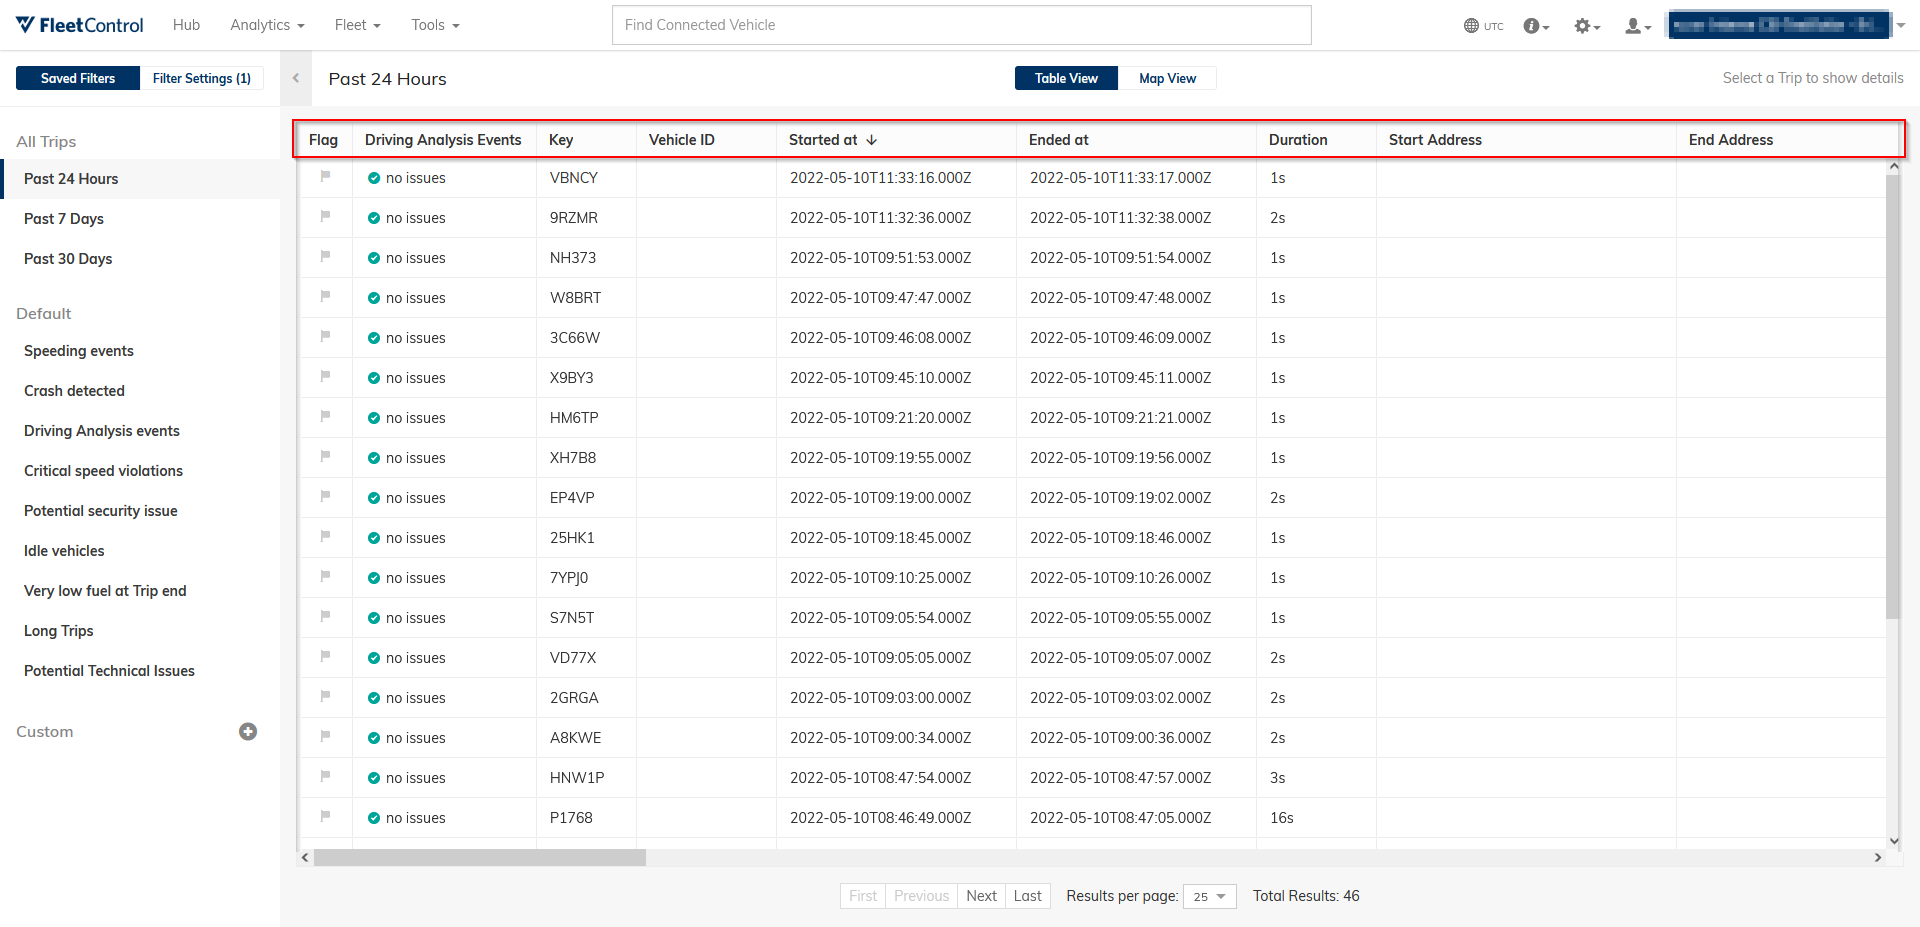
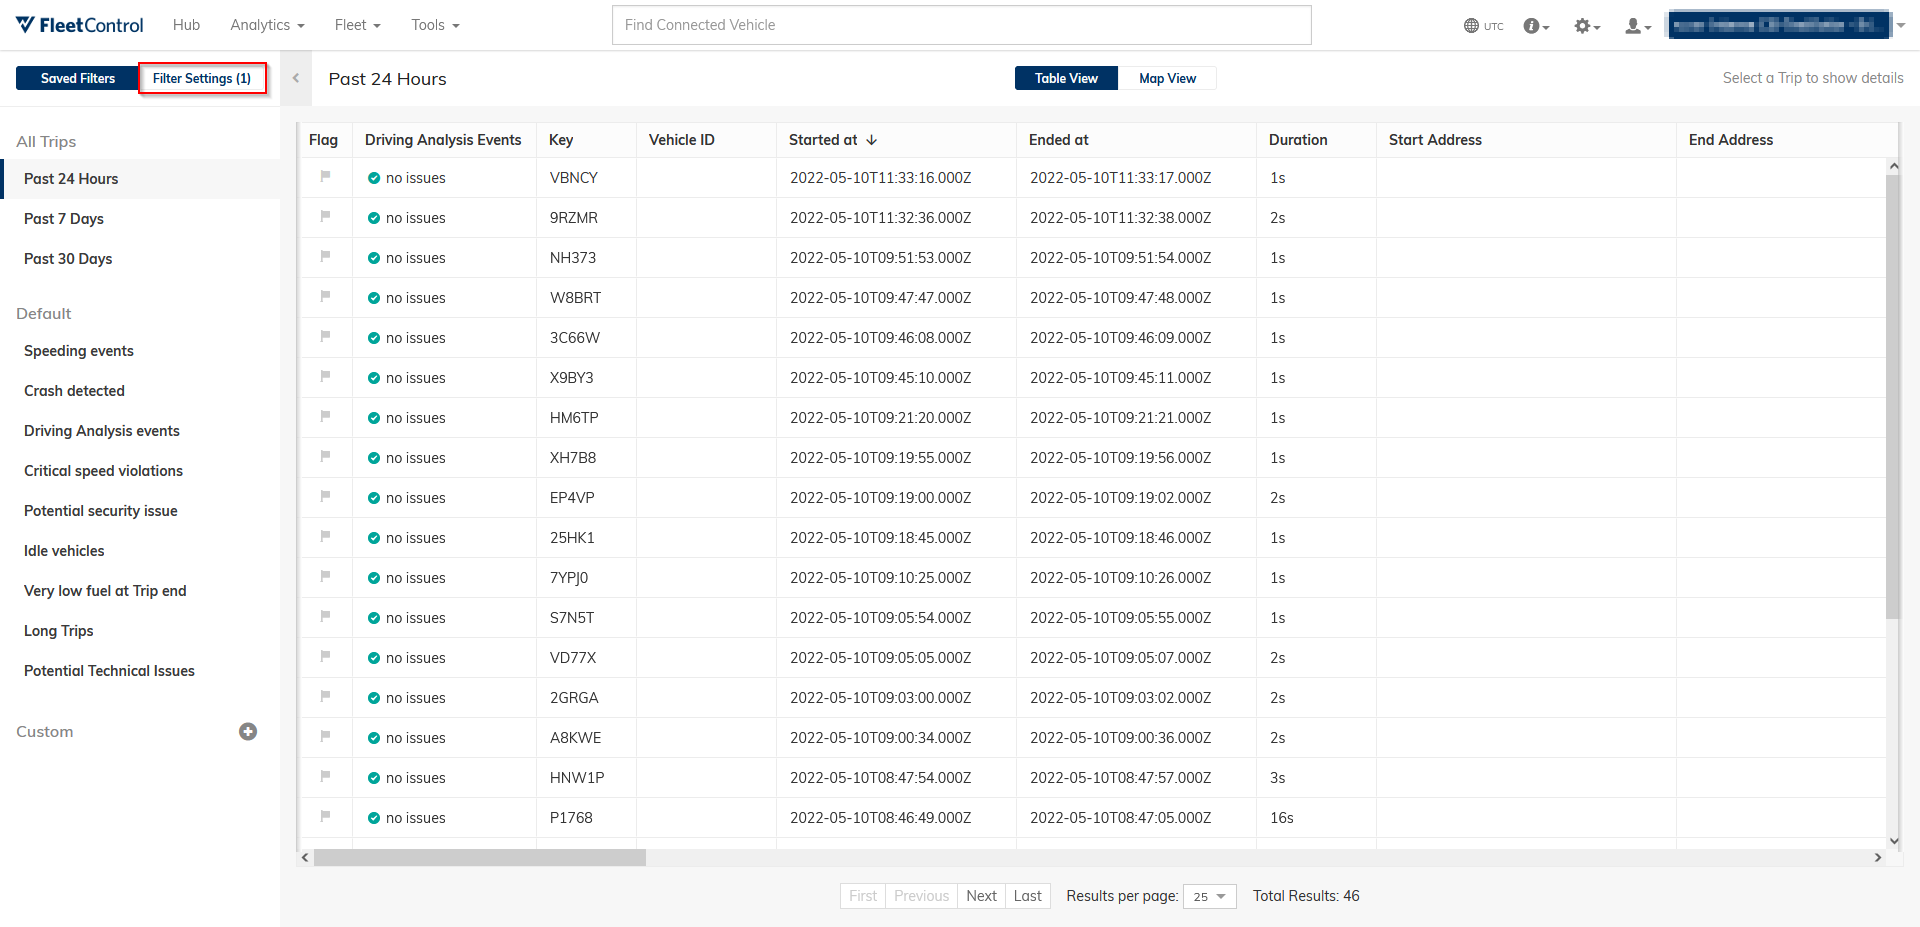
The list view allows you to easily find and compare trips. It contains all of your fleet’s trips in the selected time frame. Click on any of the columns to sort by that data point in ascending or descending order. Drag and drop columns horizontally to rearrange your list view.
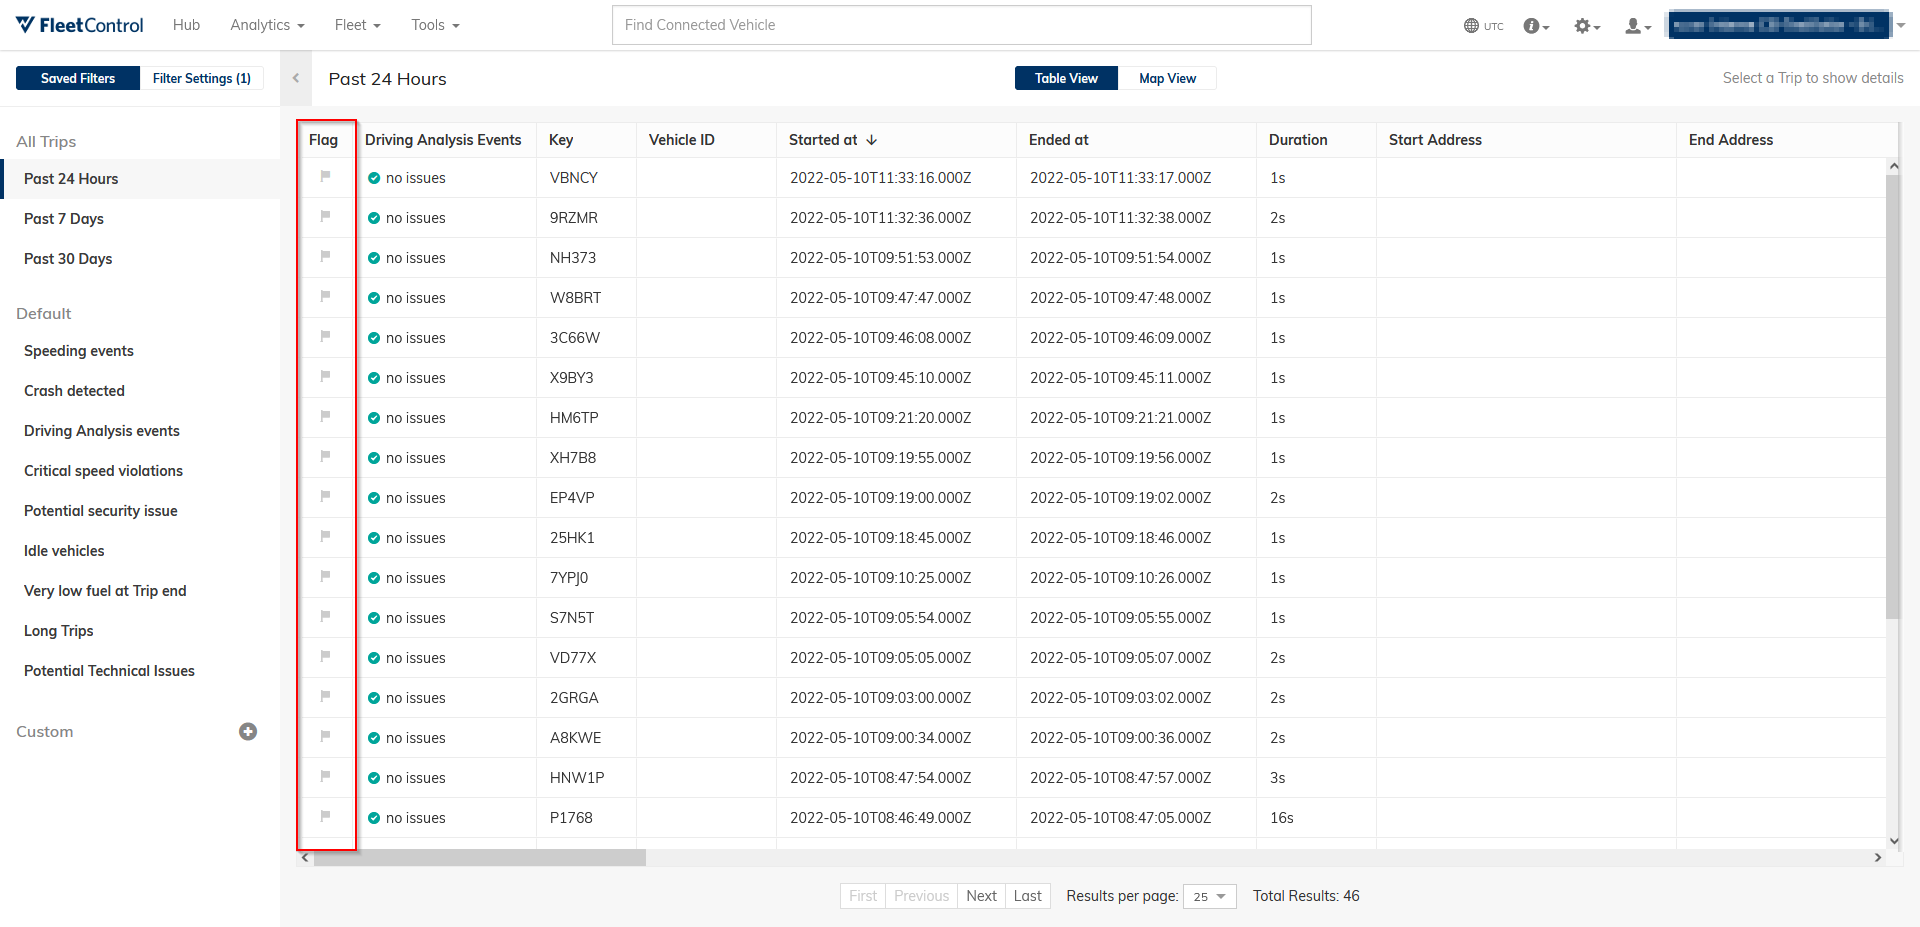
Use the flag icon in the respective column to highlight trips for later use or to bring them to your coworkers’ attention. Flags are persistent and trips will stay flagged until manually unflagged.
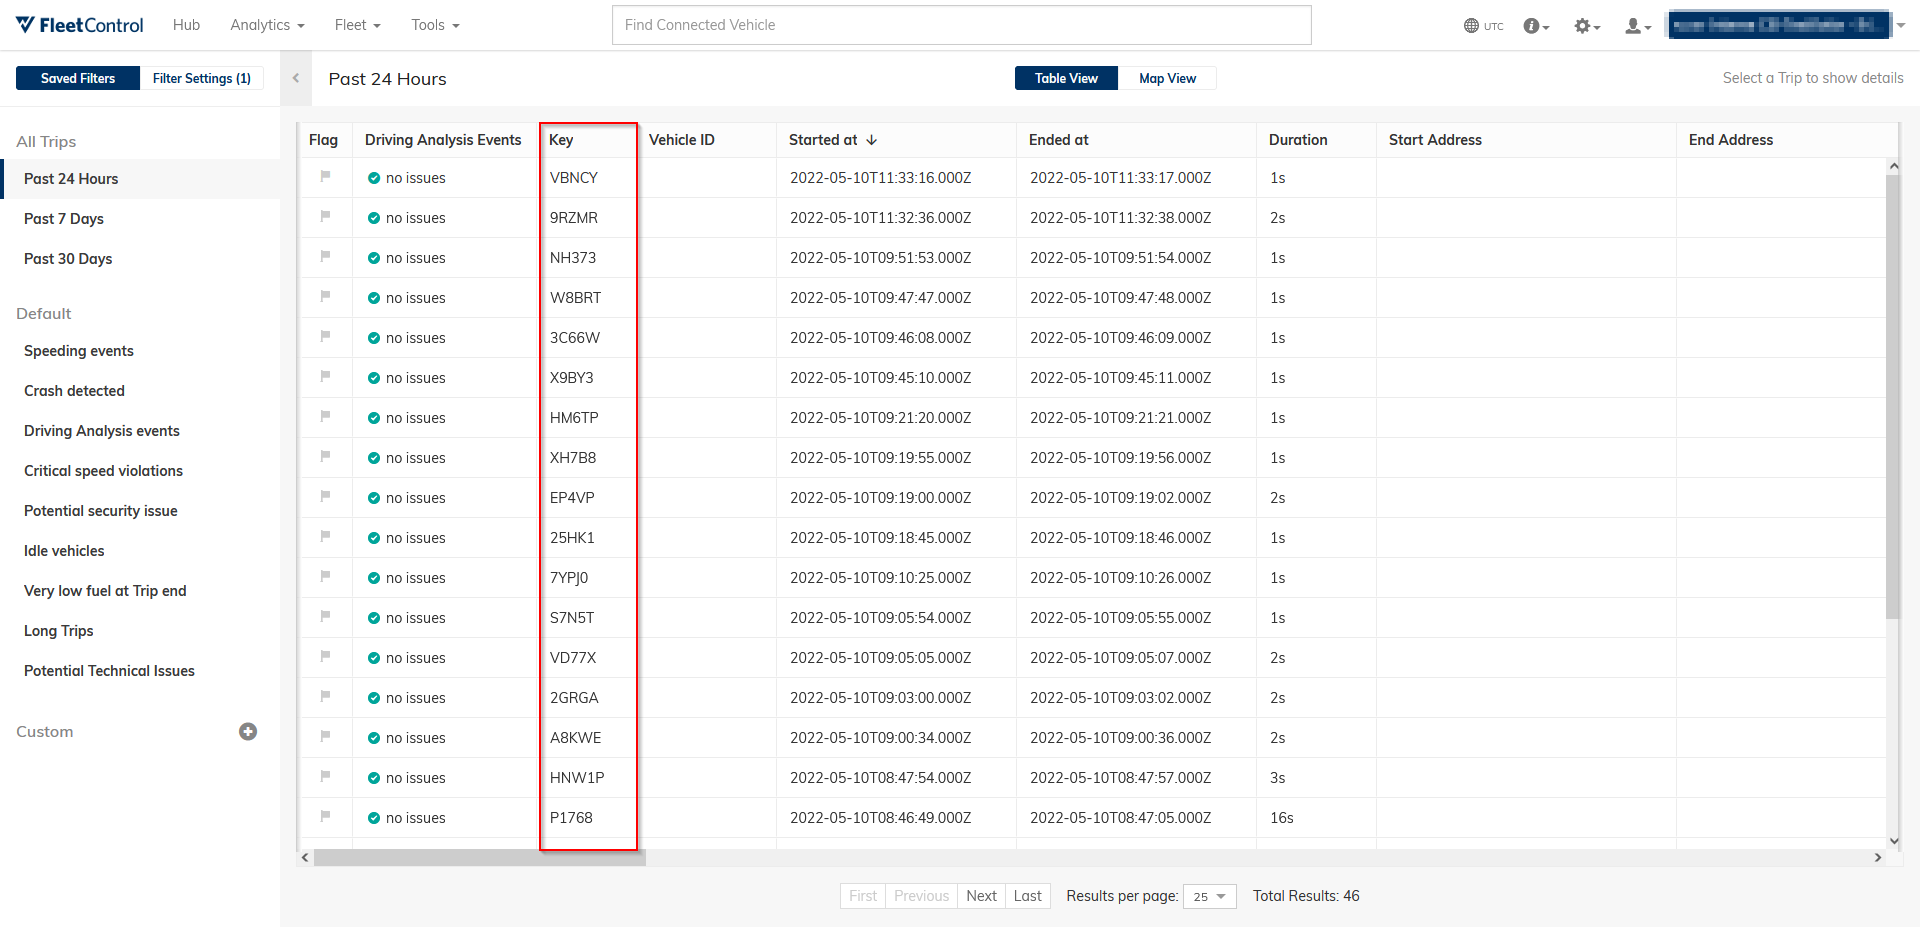
Every trip has a unique trip ID and a trip key. The trip key acts as an abbreviation to the longer trip ID. You can find trips by searching for their trip ID or trip key.
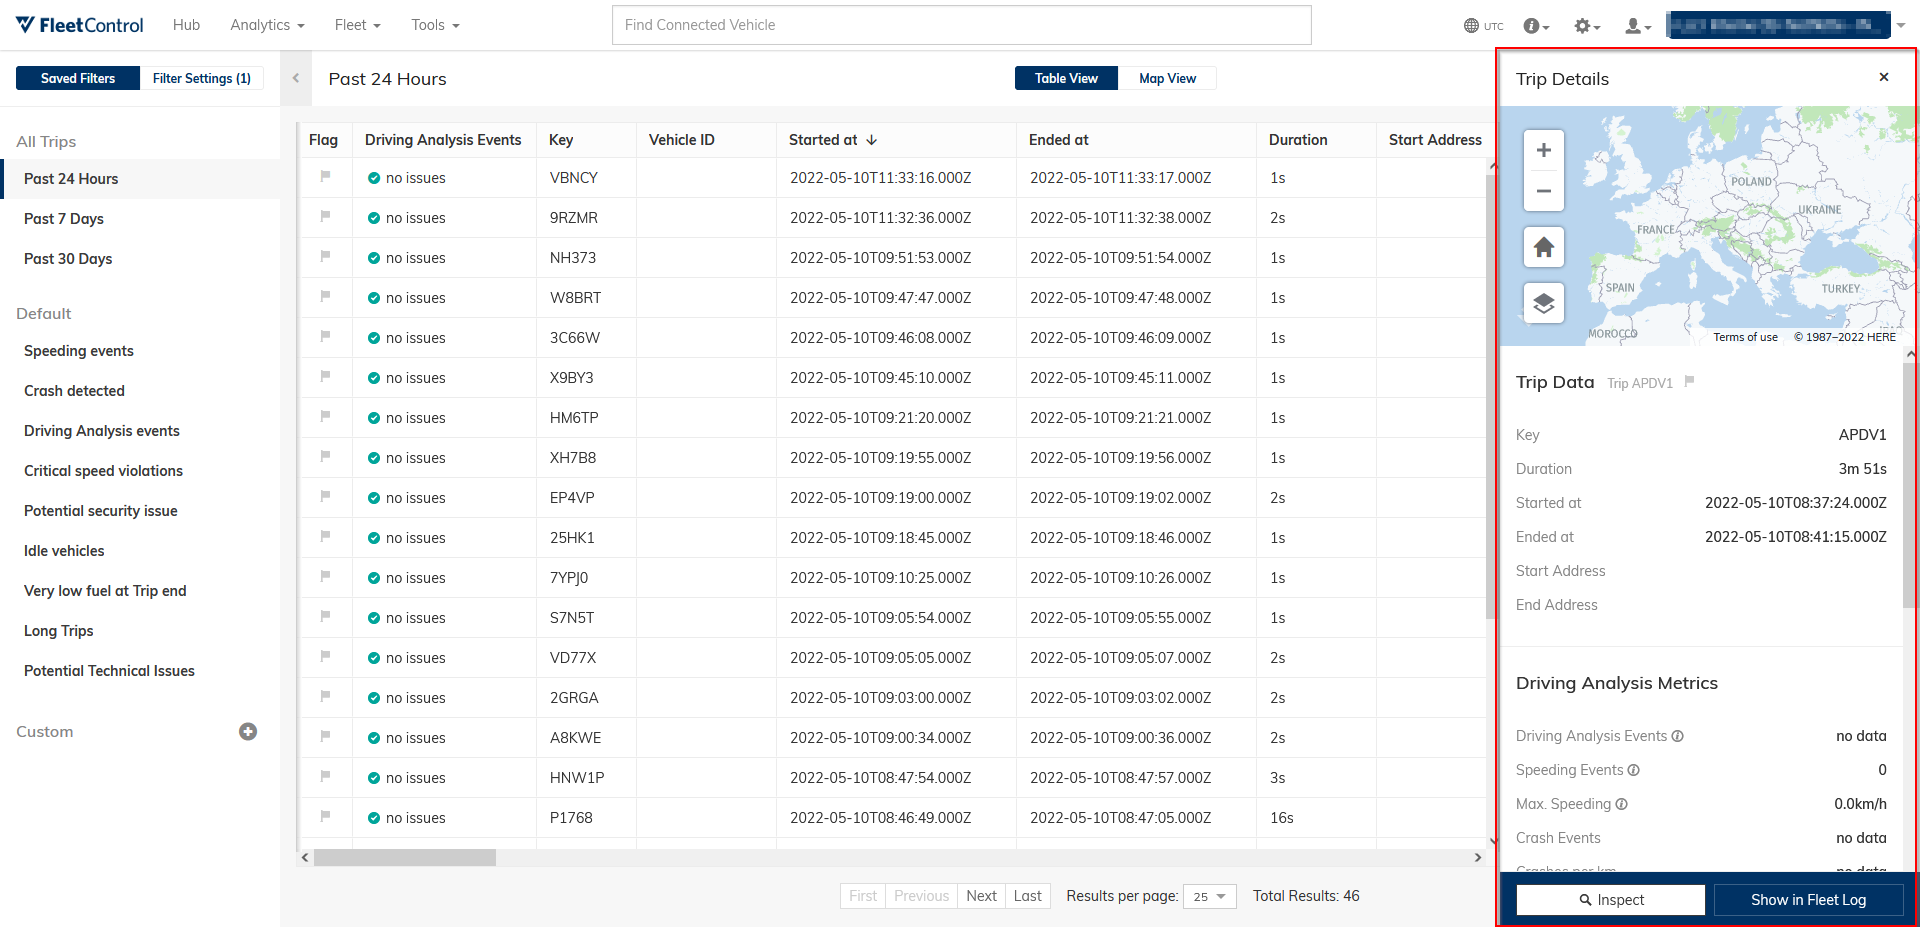
Click on any trip to open its trip details. Here, you can view the trip’s route as well as the most important data. If you want to view more detailed information, select Show in Fleet Log in the bottom right.
Filters⚓︎
You can apply various filters to the list view in order to find trips that fulfill certain criteria.
Applying filters⚓︎
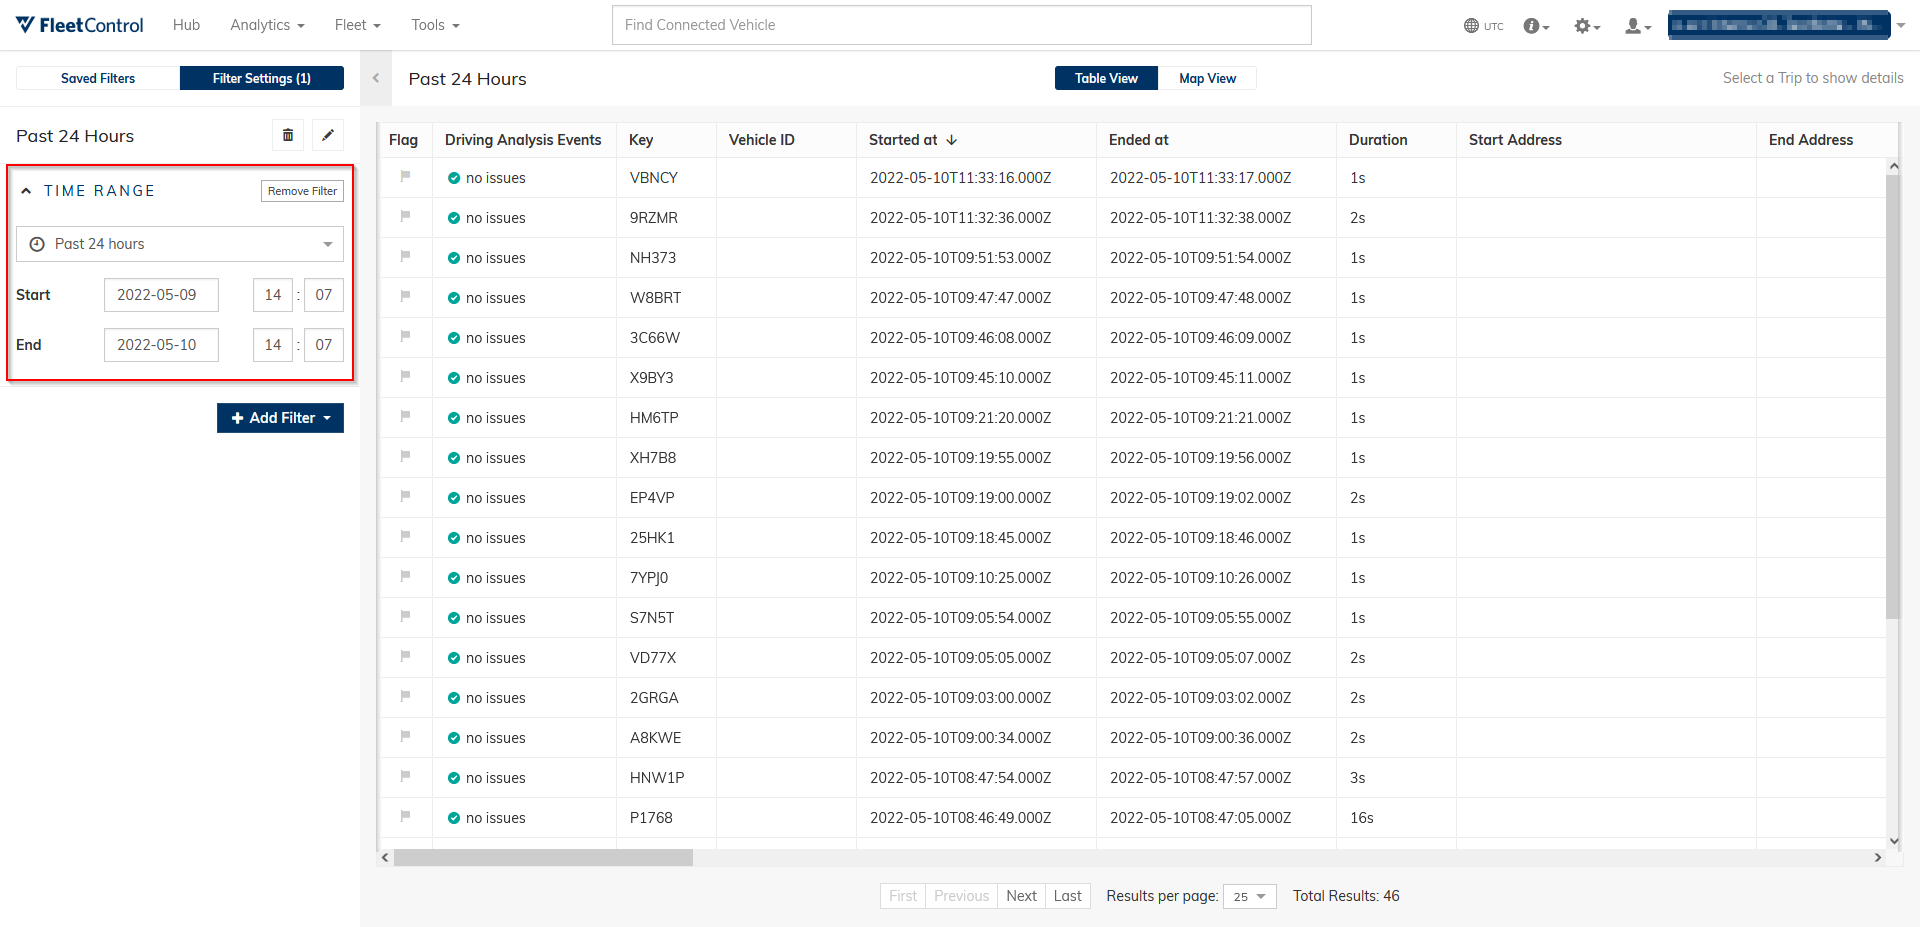
To apply a filter, click Filter Settings in the top left.
You can set a time frame to only display trips from within it.
Click + Add Filter and choose a category to apply a new filter. Start adress and End adress both allow you to filter for trips based on the location of their start or end point. Vehicle data contains a variety of values related to fleet units’ master data and their usage.
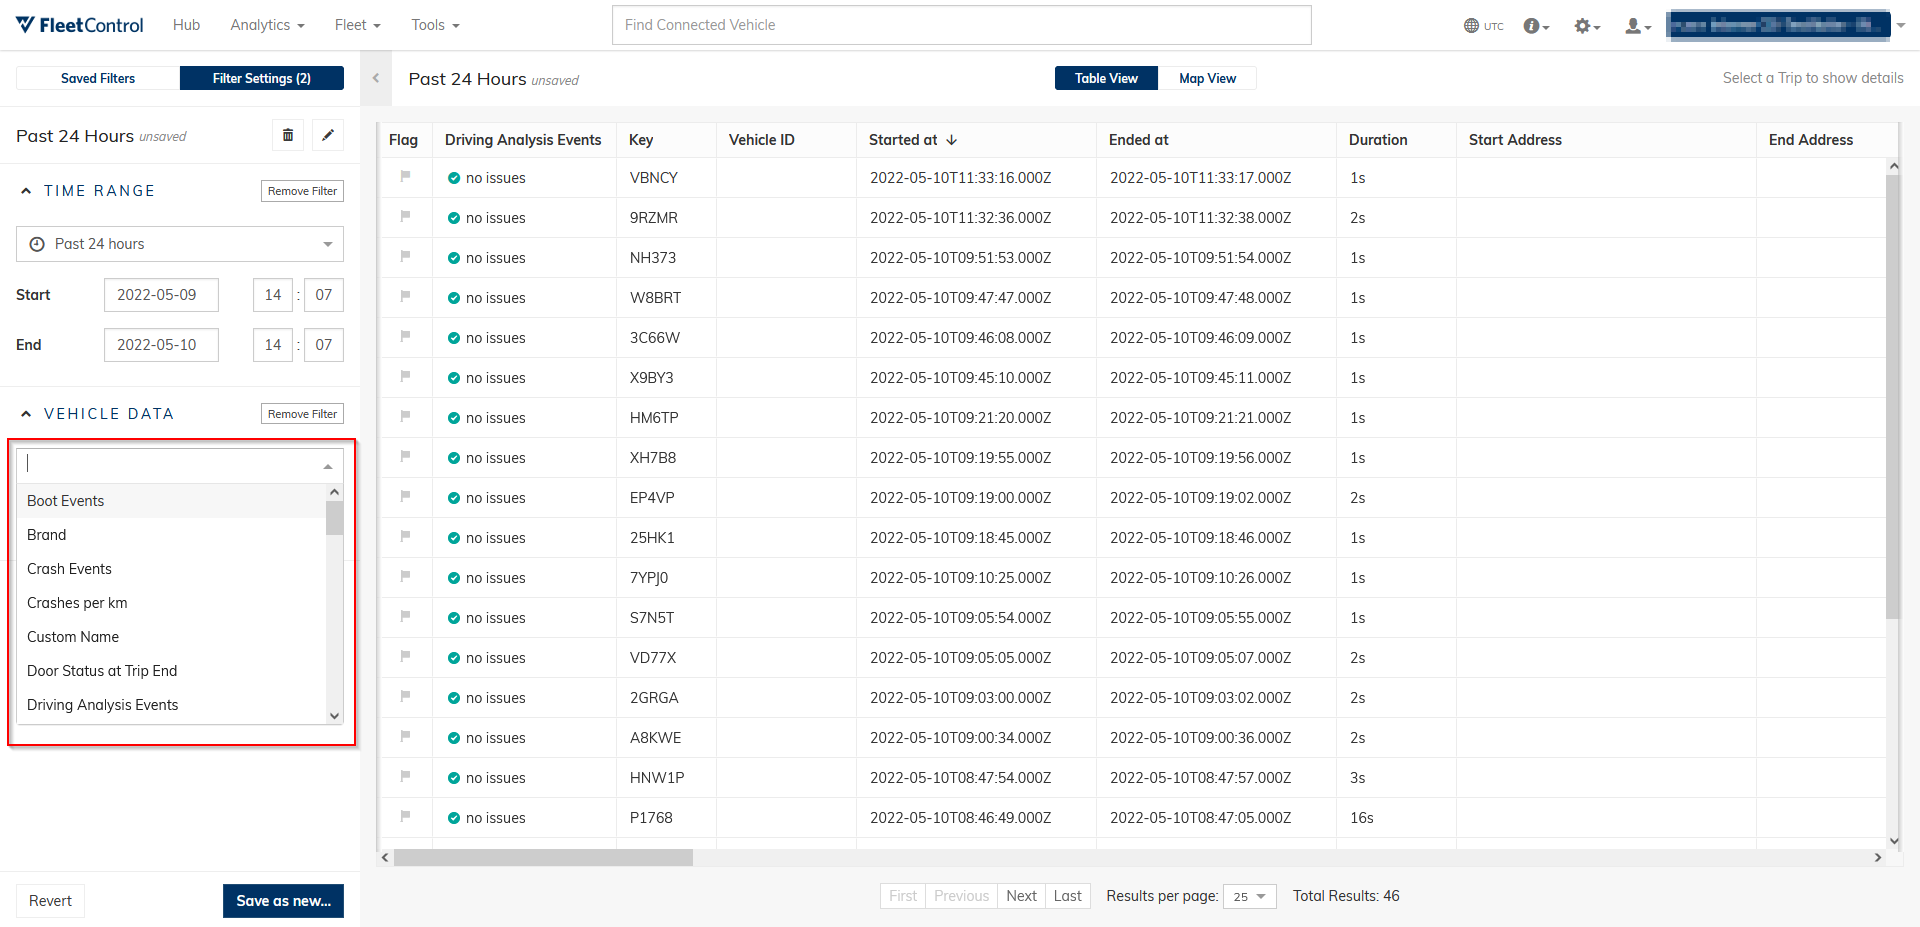
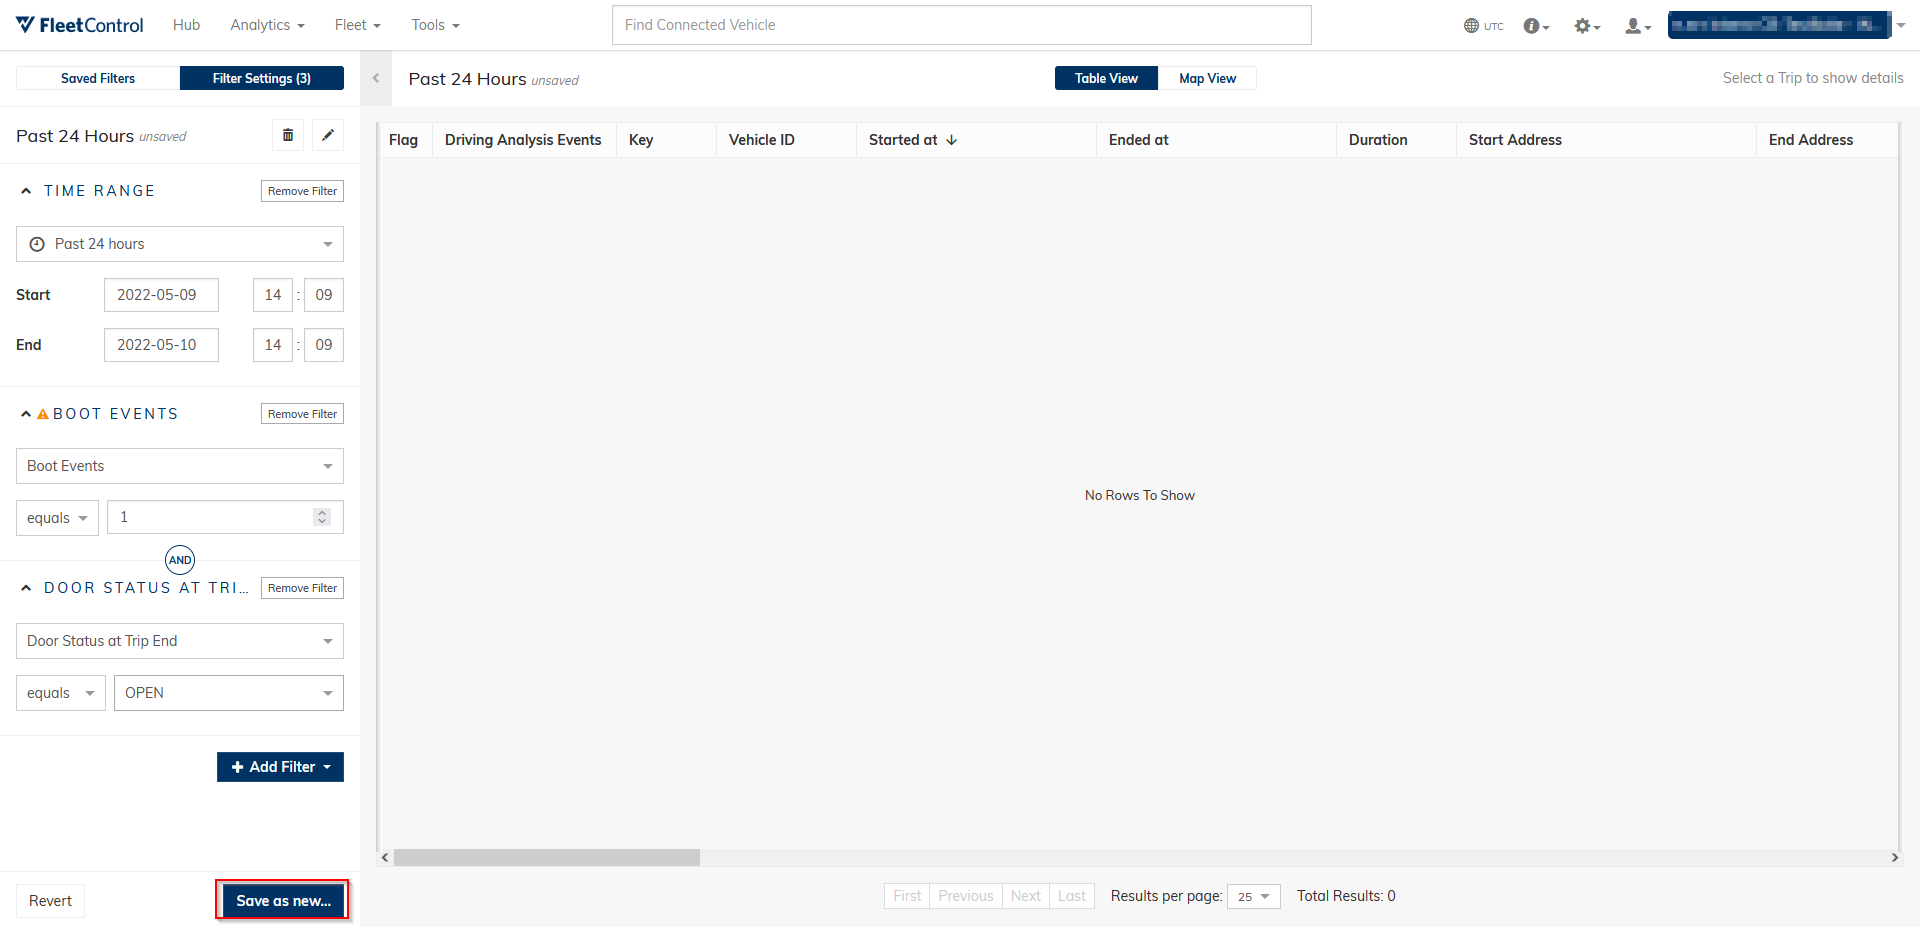
Select a filter and set the value you want to search for. To apply additional filters, simply click + Add Filter again and select another value from the list. Click the Boolean operator to switch from AND to OR and vice versa.
Info
If you have purchased the driving analysis extension, you can view and filter for additional events, such as speeding.
Presets⚓︎
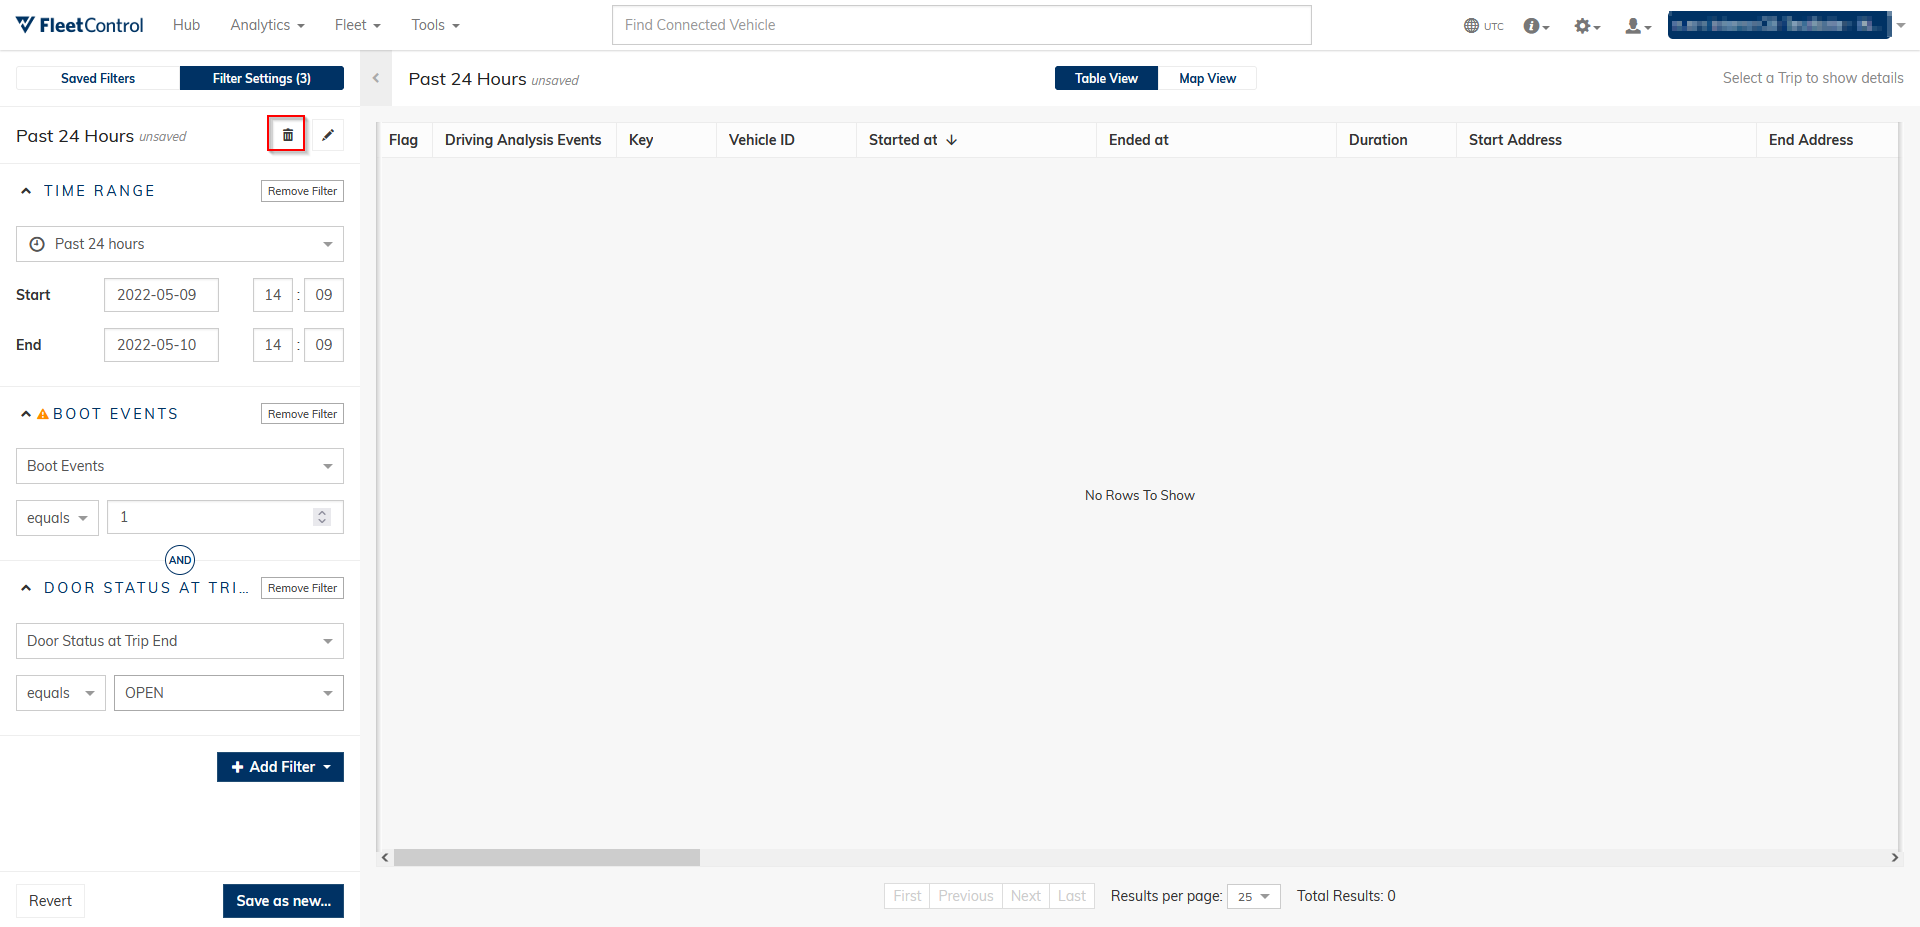
If you want to reapply a set of filters frequently, you can save it as a preset. To do this, open the Filter Settings and apply your desired filters. Then, click Save as new… to create a new preset. Finally, choose a name.
From now on, the preset will be available on the left. To delete a preset, click on its name to apply it. Then, open Filter Settings and click the Trashcan icon at the top.
Map view⚓︎
The map view allows you to visualize your trip data in a variety of ways to gain insights into your fleet’s usage.
Loading data⚓︎
To use the map view optimally, you should first decide on the data you want to visualize. Choose a time frame and filters on the left.
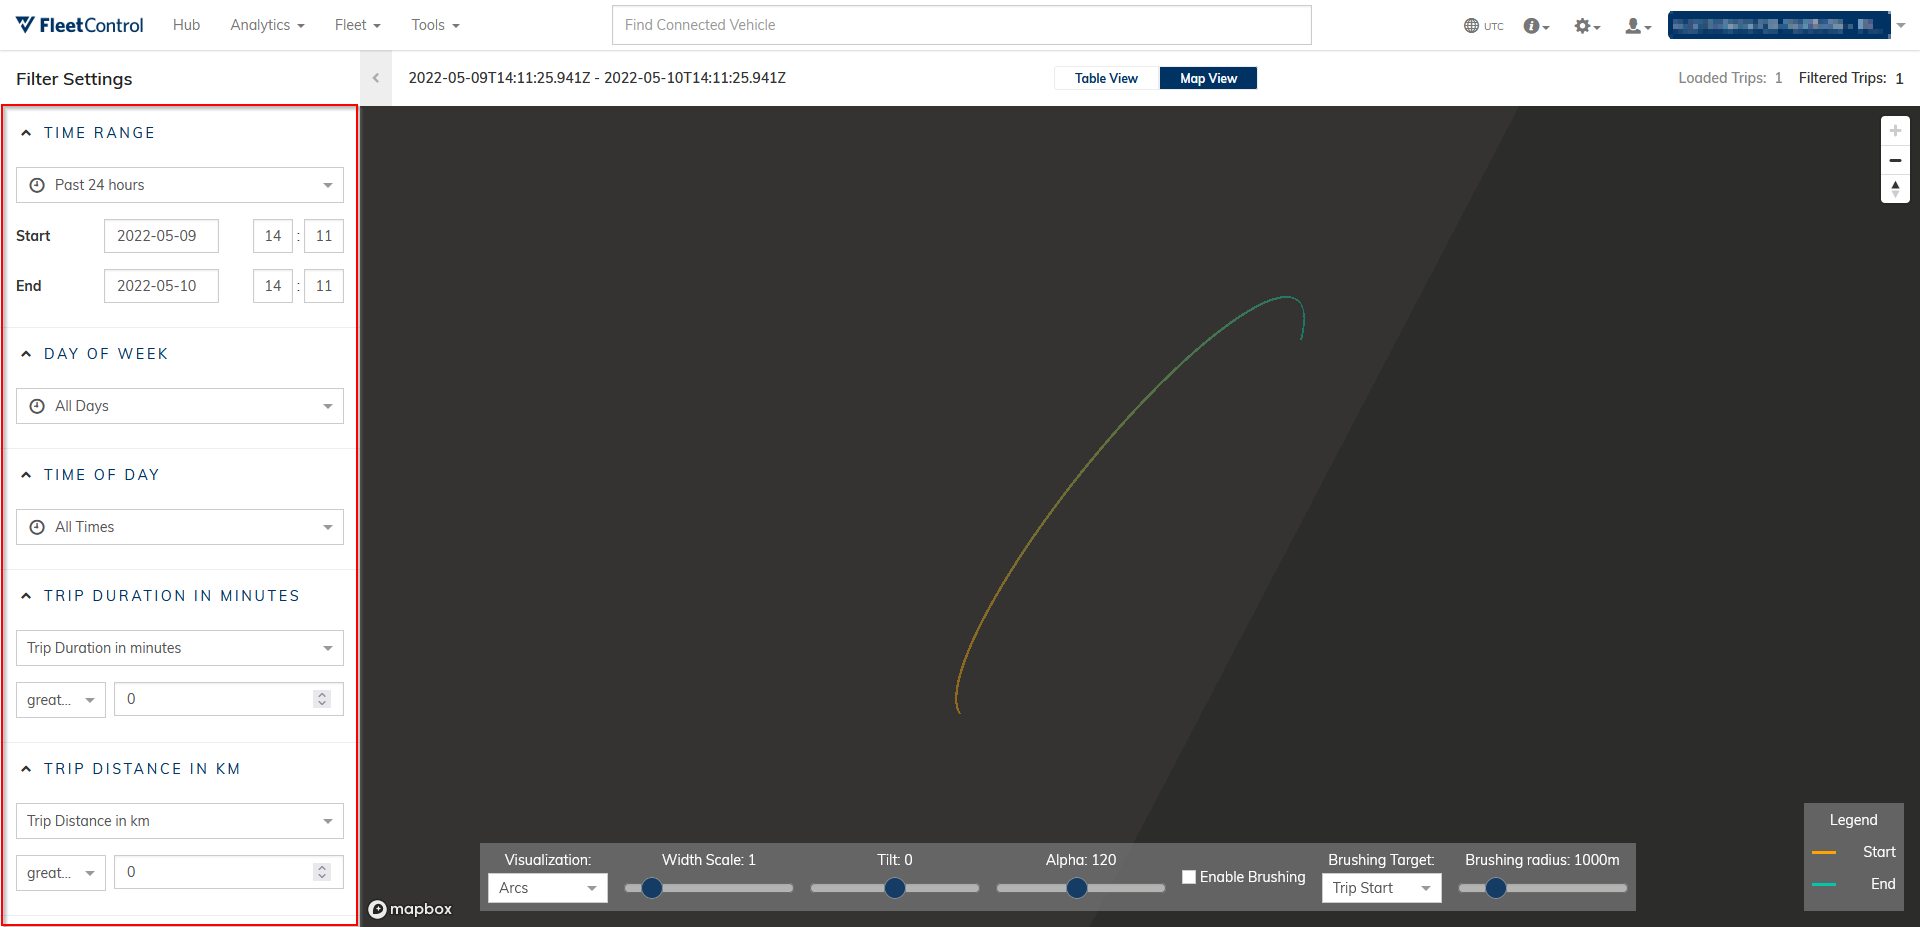
All relevant trips are then automatically loaded and cached. This may take a short time, but after the data is cached, you can adjust the visualizations to your liking without having to reload any data.
Visualizations⚓︎
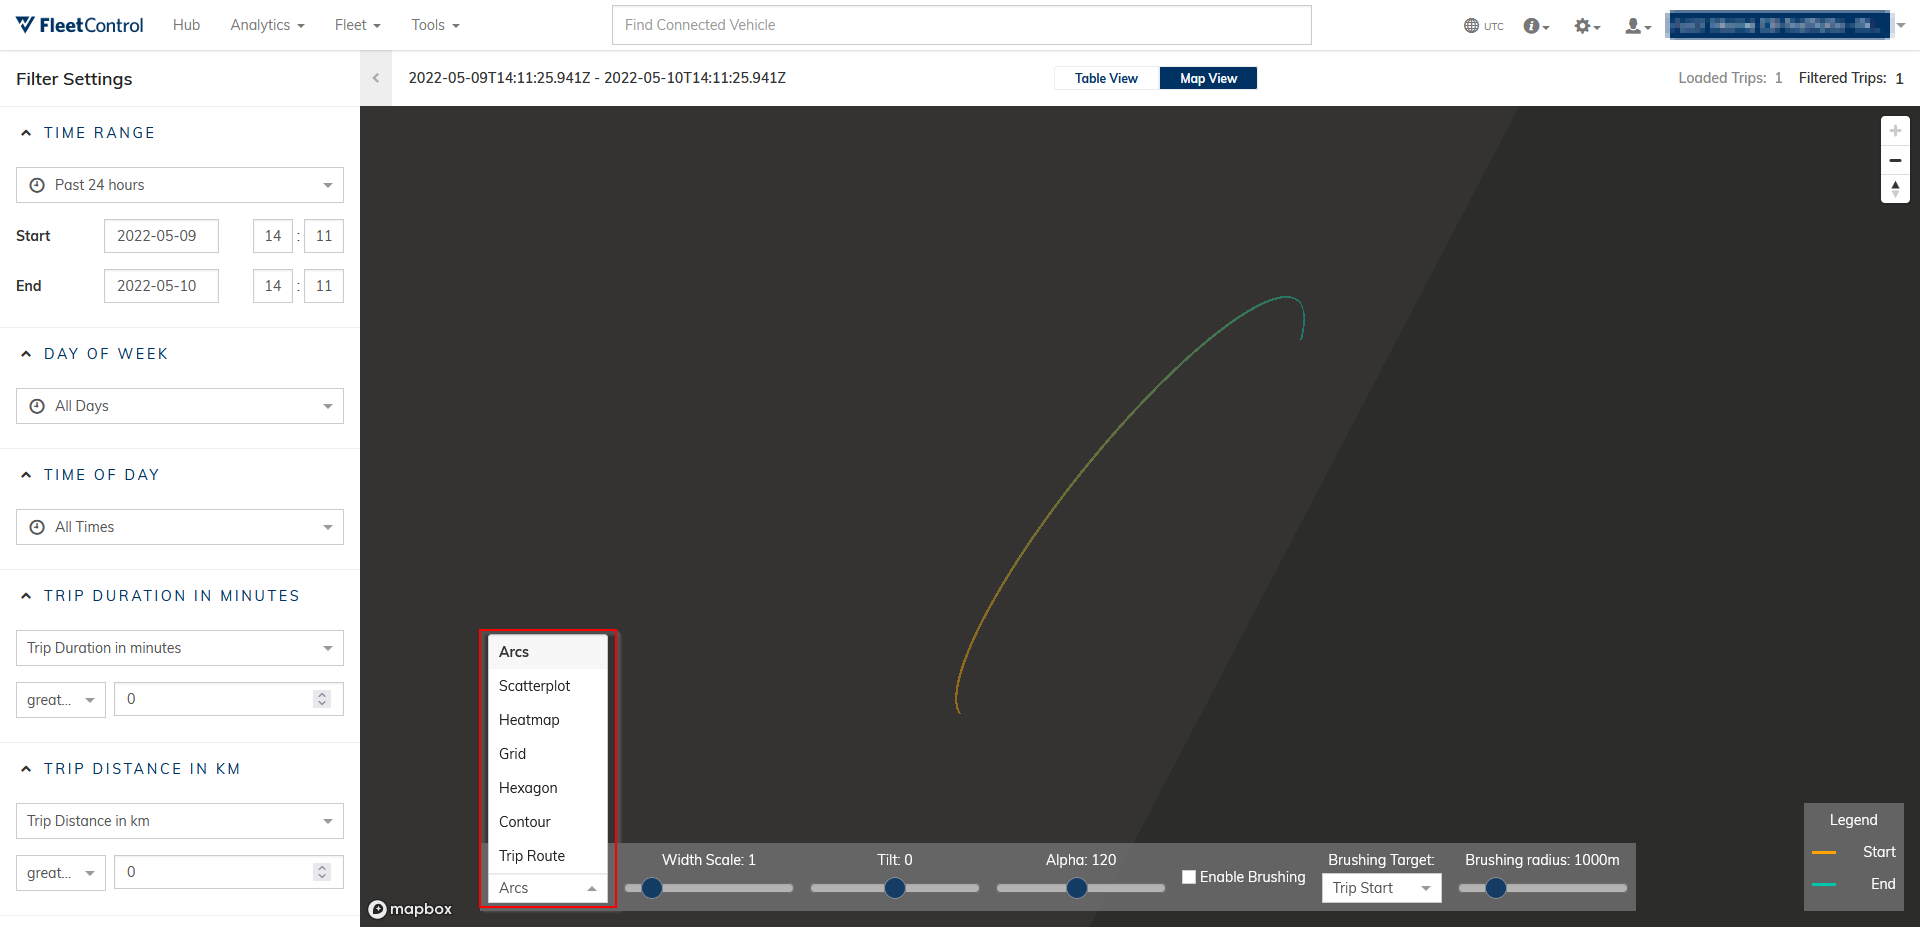
You can change the visualization type and style on the bottom of your screen.
Each style can be configured to hide data below certain thresholds or adjust the visualization.
Styles⚓︎
| Visualization | Description |
|---|---|
| Arcs | Displays colored arcs from the trips’ start to their end points. Click Enable brushing to only display arcs near your cursor. |
| Scatterplot | Displays trips as colored bubbles. |
| Heatmap | Displays the frequency of trips being started or ended per area in a heatmap. The more red an area is, the more trips were started or ended there. |
| Grid | Displays the frequency of trips being started or ended per area in 3D-columns. |
| Hexagon | Displays the frequency of trips being started or ended per area in 3D-hexagons. |
| Contour | This style has to be configured before being displayed. Choose an area and set the filters, then select Apply and Update. Displays the frequency of trips in automatically generated cells. |
| Trip route | Displays the duration and length of trips with lights that move from the trips’ start to end points. |