Events (Fleet Log)⚓︎
Fleet Log contains multiple features that allow you to stay up-to-date on your fleet units. You can view trips and the events and trackings they are comprised of. Additionally, Multiview allows you to monitor your fleet at a glance while the map view highlights crashes and other important events.
You can purchase the driving analysis add-on to access data on speeding and other undesirable driving behaviors during trips. You can use Fleet Log regardless of whether you have purchased the driving analysis add-on, but its added benefits will greatly enhance your experience.
Multiview⚓︎
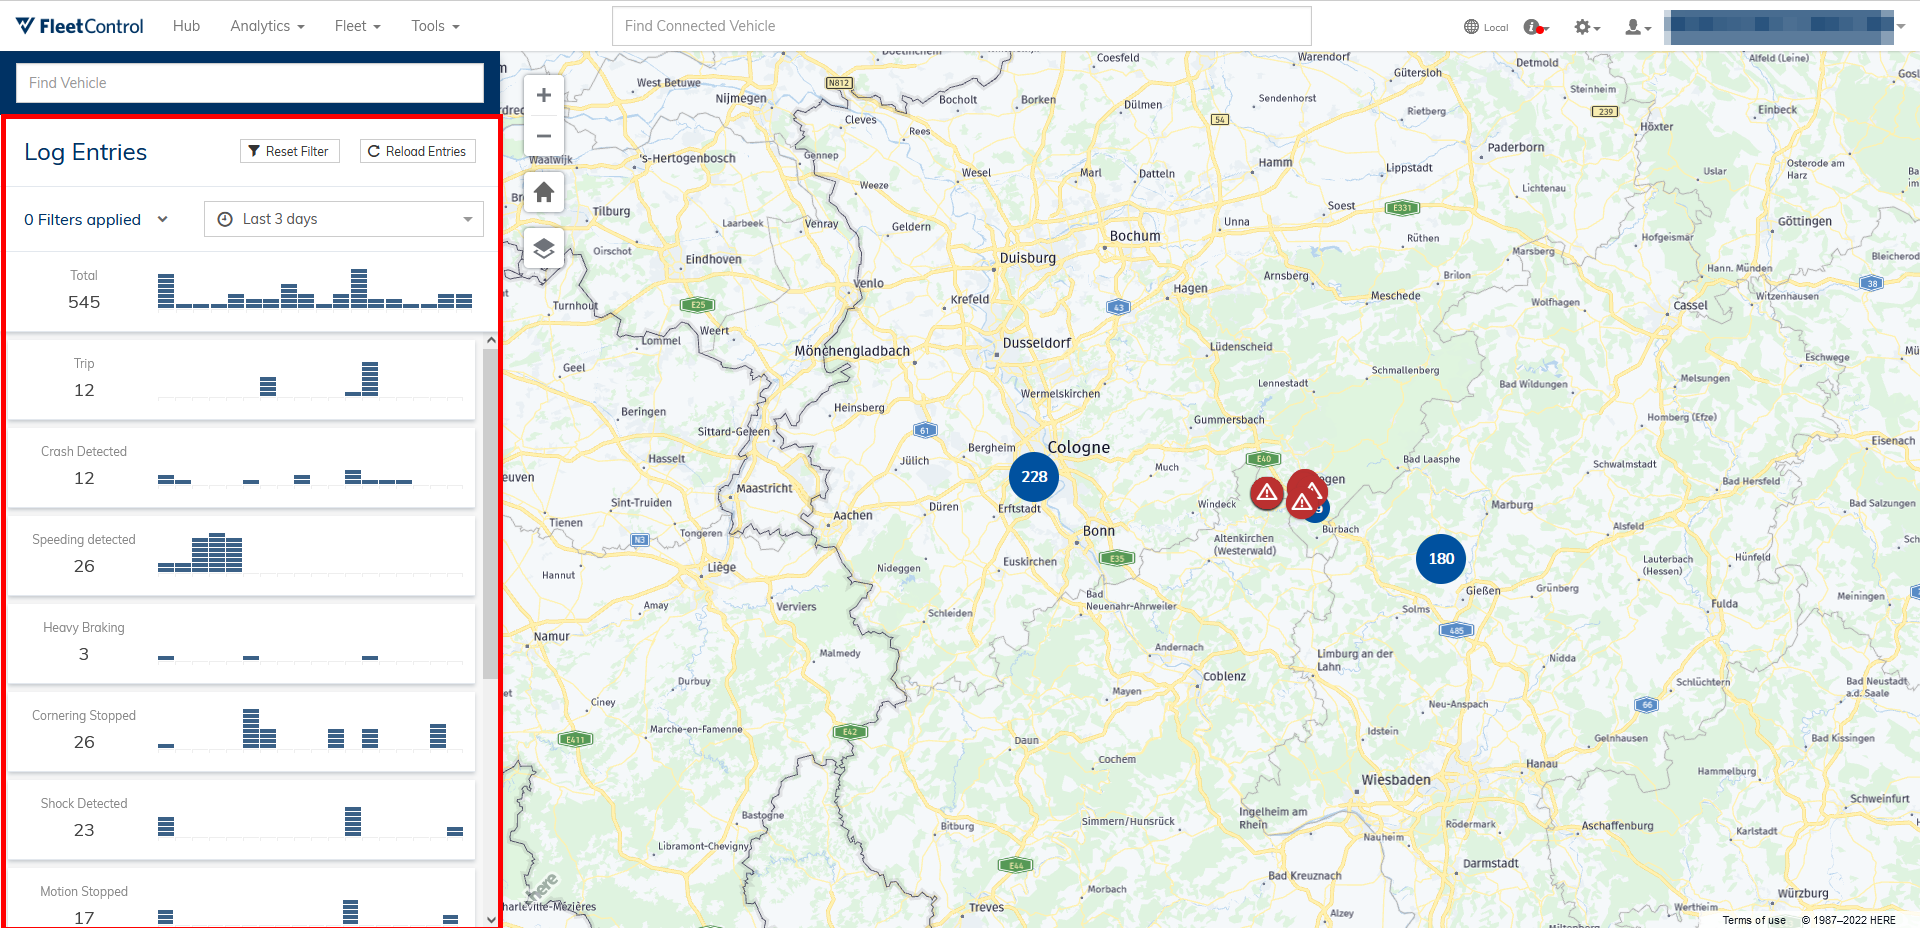
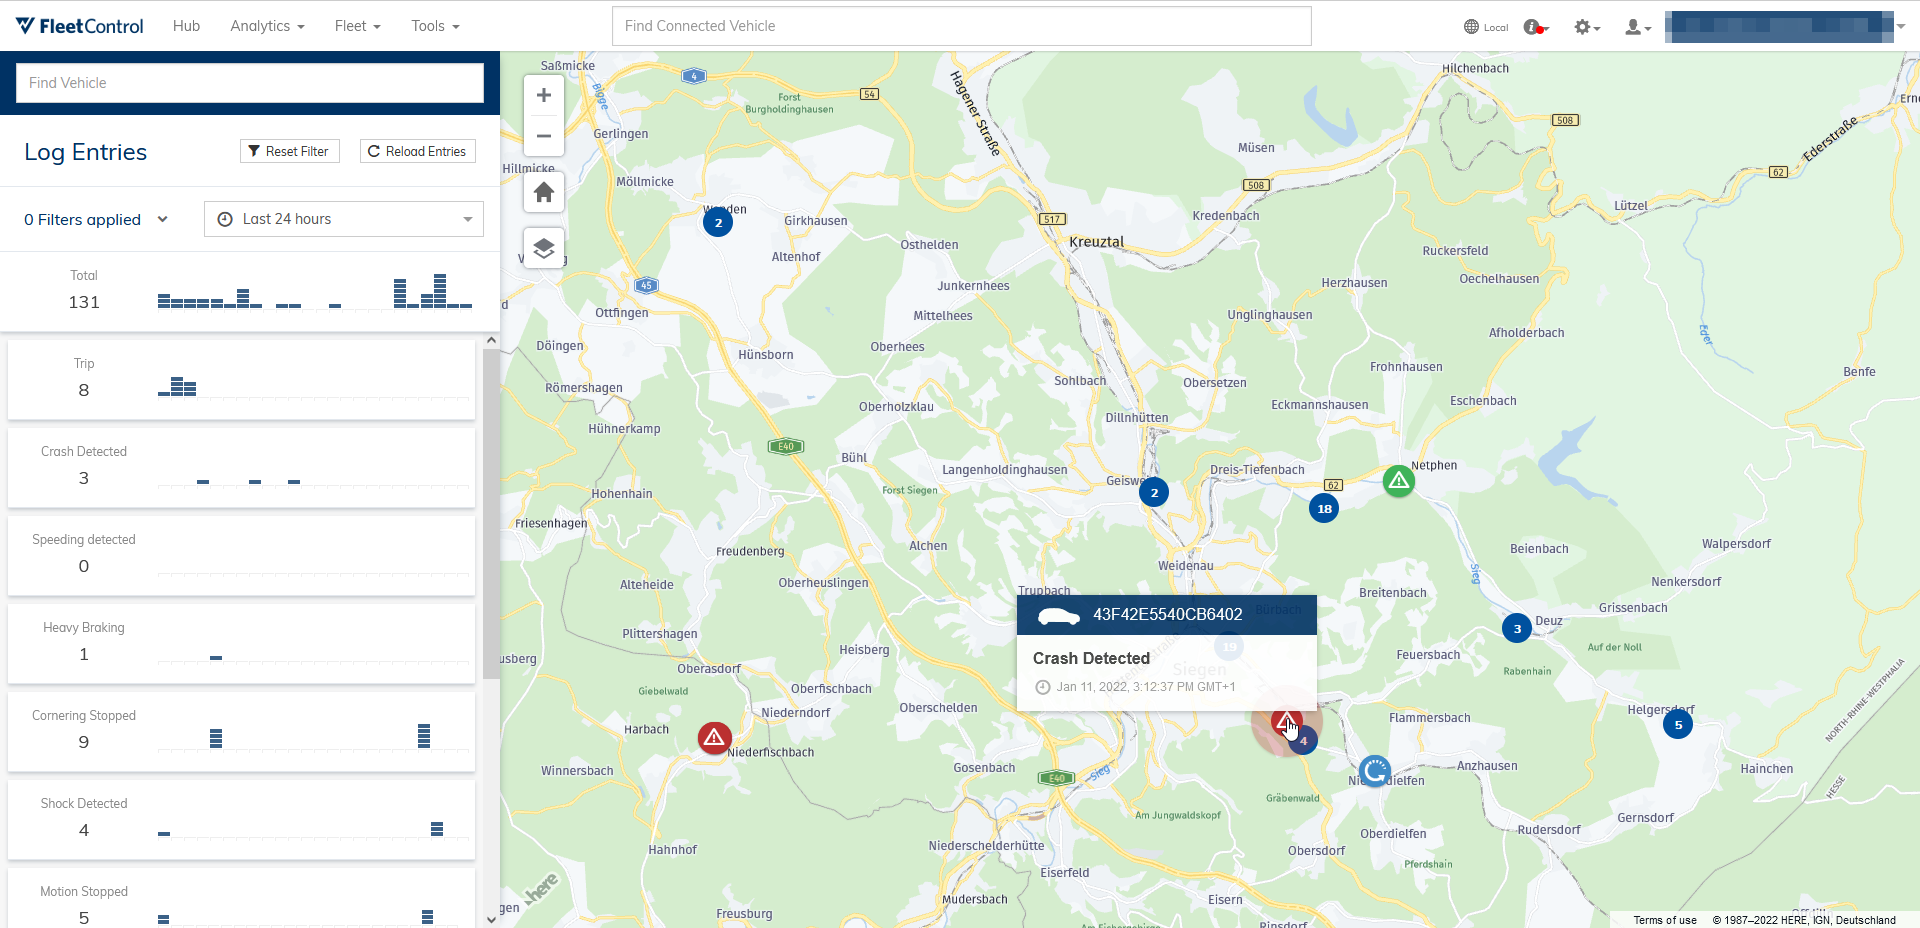
The left side of Fleet Log contains the Multiview. Here, you can monitor the most important events in your fleet at a glance. The visualizations show the frequency of your fleet’s total events as well as the frequency of the following event reasons over the selected time frame. The basic versions’s Multiview contains the following event reasons:
- Trip started
- Trip ended
- Boot
- Low battery alarm
- Fuel level alarm
After purchasing the driving analysis add-on, your Fleet Log’s Multiview will also include the following event reasons:
- Crash detected
- Speeding detected
- Heavy braking
- Cornering stopped
- Shock detected
- Motion stopped
- Tilt status changed
You can select the desired time frame from the drop-down-menu at the top or by applying a custom filter. In the example below, the driving analysis add-on has been purchased, so multiple additional event reasons are shown.
Map and map tags⚓︎
The map to the right contains an overview of the location of events for the selected time frame.
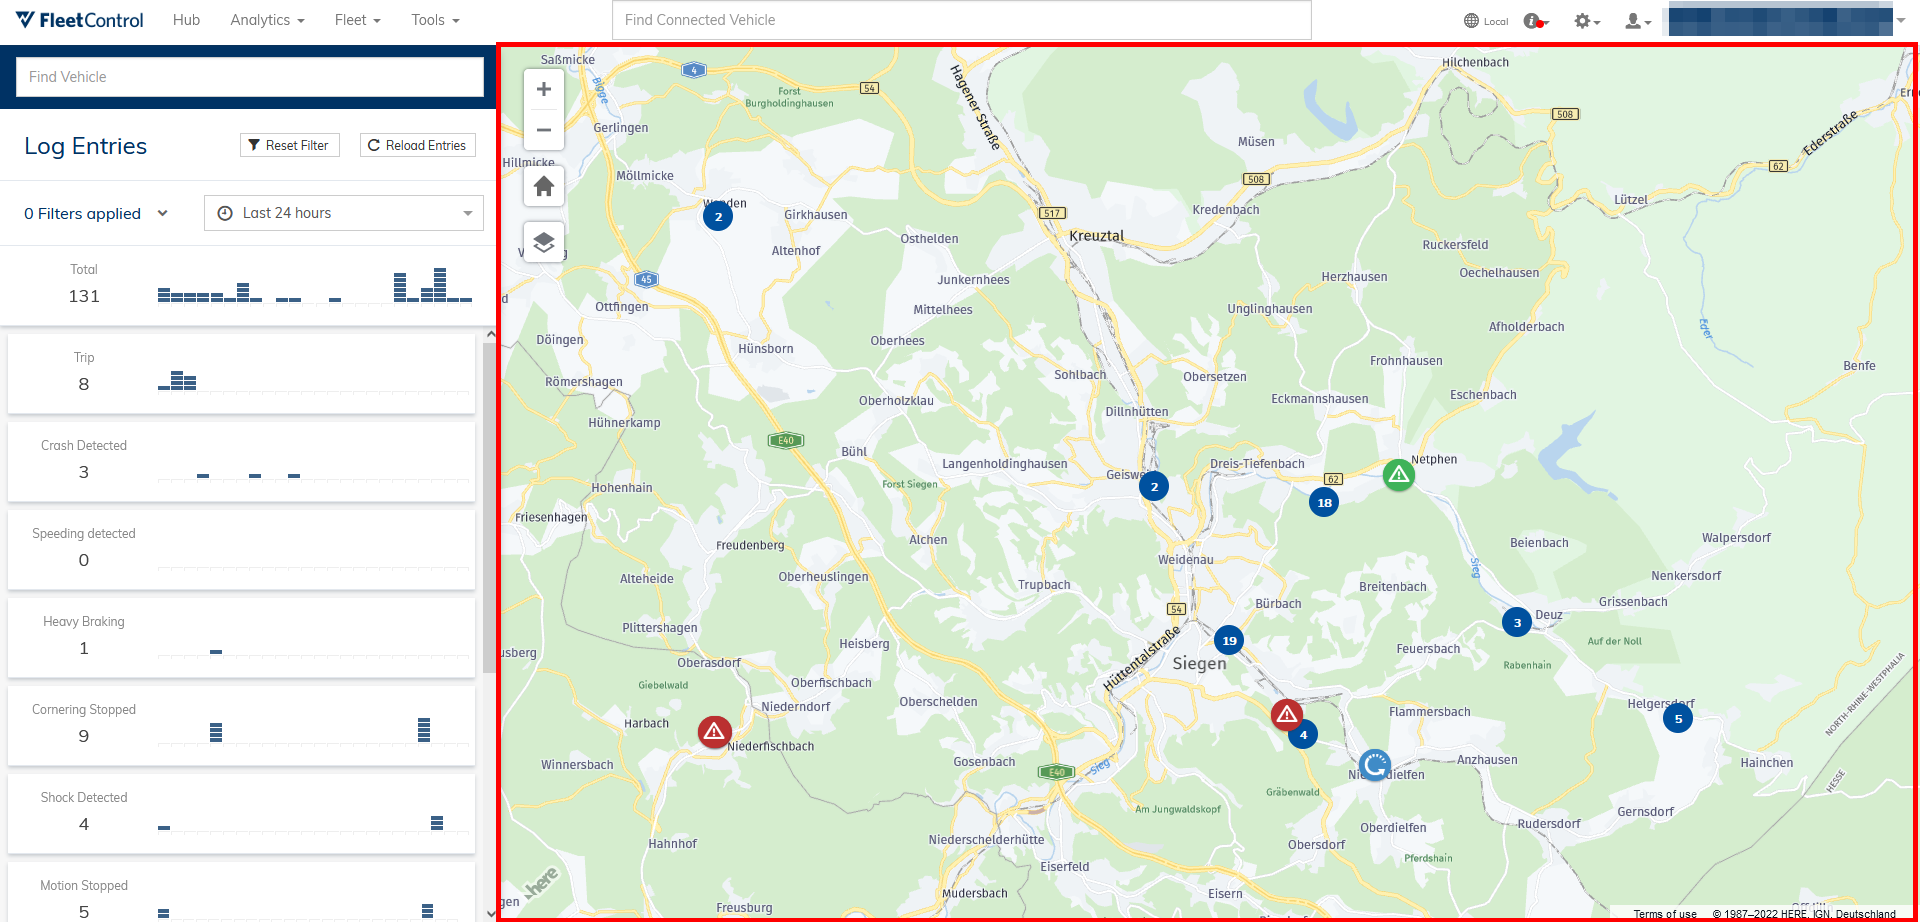
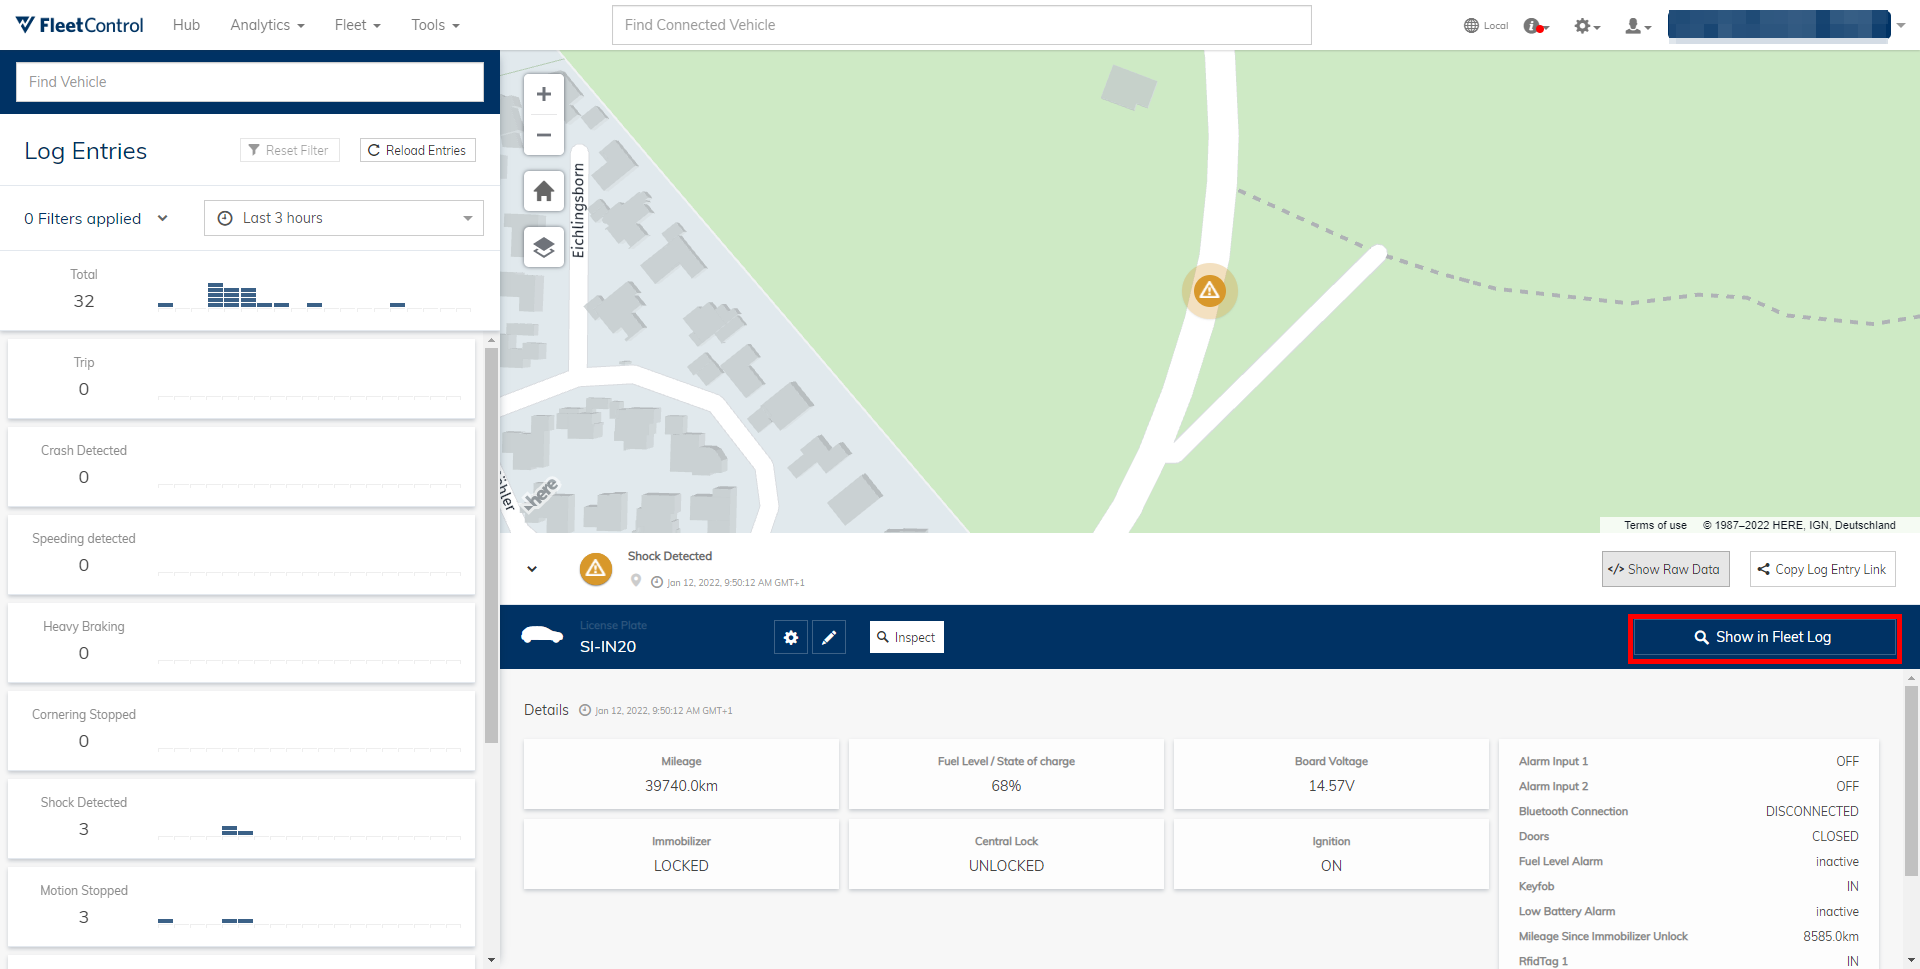
Normal events related to trips, mostly location trackings, are represented by blue map tags. For ease of use, these events are clustered together depending on your zoom level. Clicking on one of the clusters zooms in on the location and shows the detailed locations of the comprising events. Map tags for important events, mainly crashes, are red. They are never clustered together with other events, so you can always select them immediately. Selecting an individual map tag opens the detailed view for that event. Here, you can view all relevant information. Click Show in Fleet Log, to open the associated trip.
Trips⚓︎
When you have selected a trip, all of its comprising events are shown chronologically on the left.
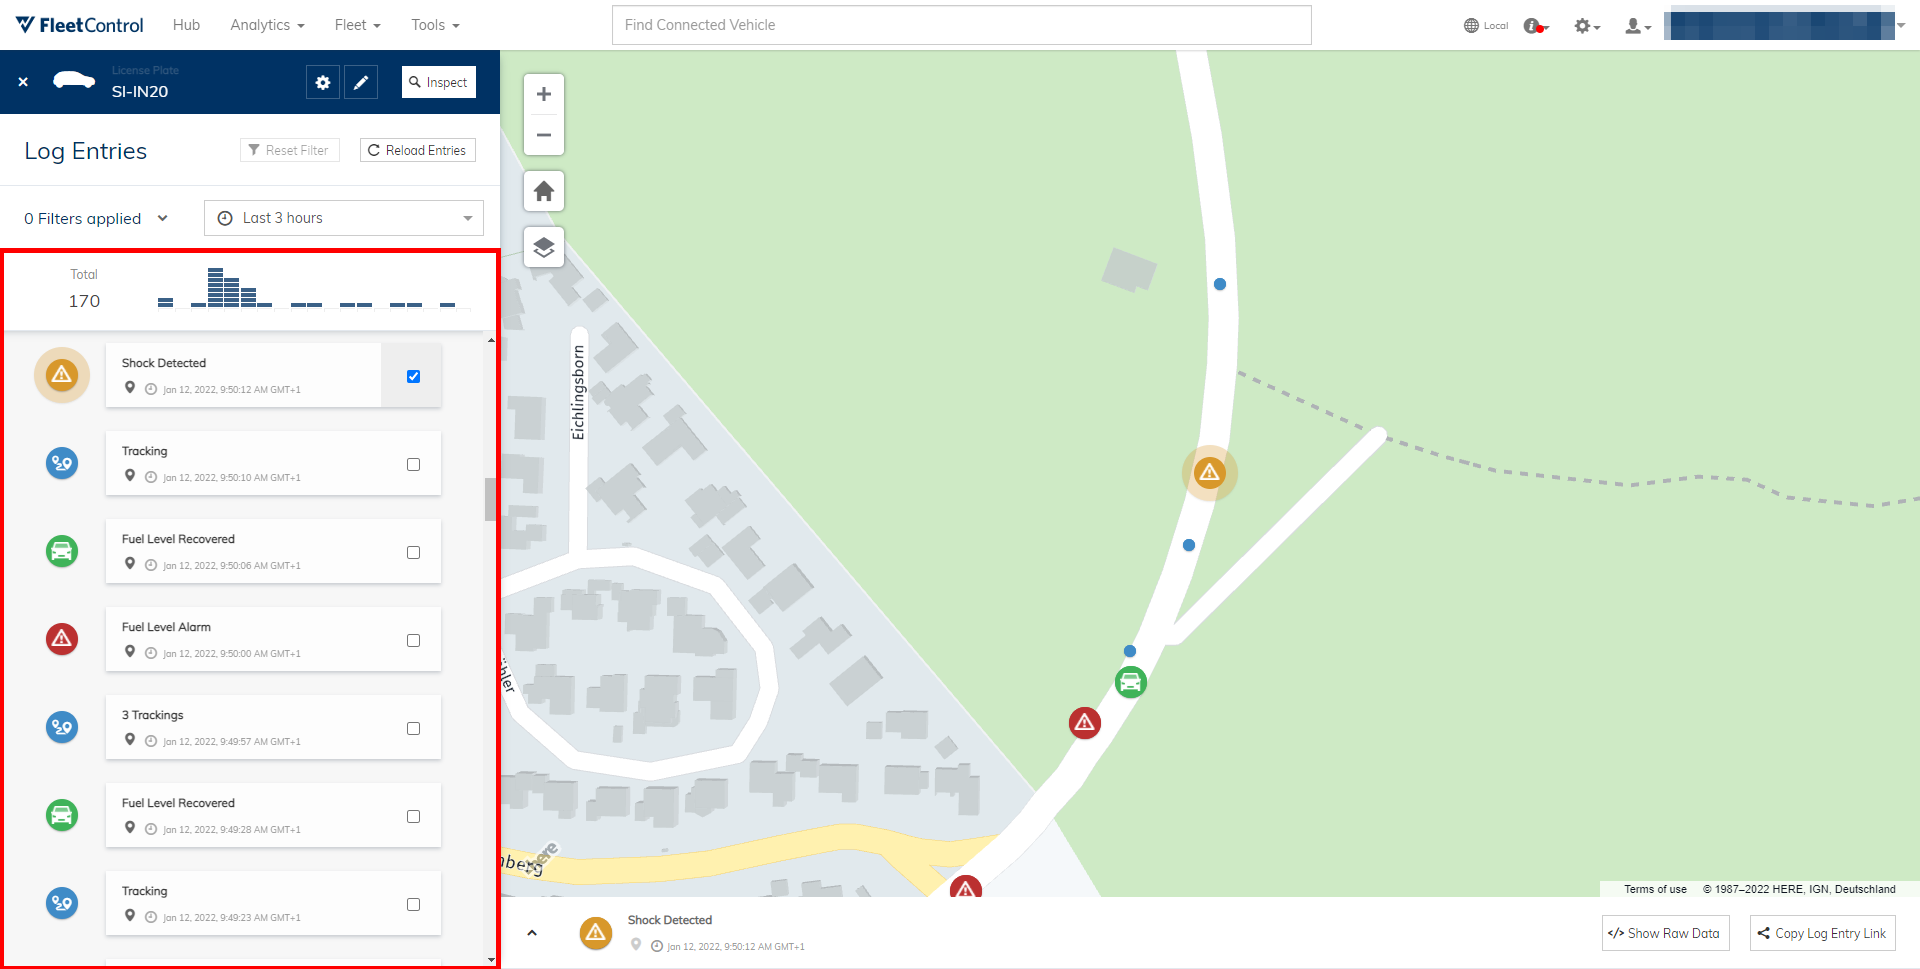
Trackings are clustered together and contain information on the vehicle’s speed. Other events contain information relevant to their type. For example, Fuel Level Alarm contains the fuel level at the time of creation. You can select individual events to view detailed information below the map view or select multiple events at once to share them as raw data or in the form of a permalink.
Speeding⚓︎
Driving analysis add-on
Speeding is a part of the driving analysis add-on which you can purchase to upgrade your Fleet Log.
Speeding events are created when vehicles travel faster than the speed limit. You can find them in trips or filter for them using the Multiview’s filters.
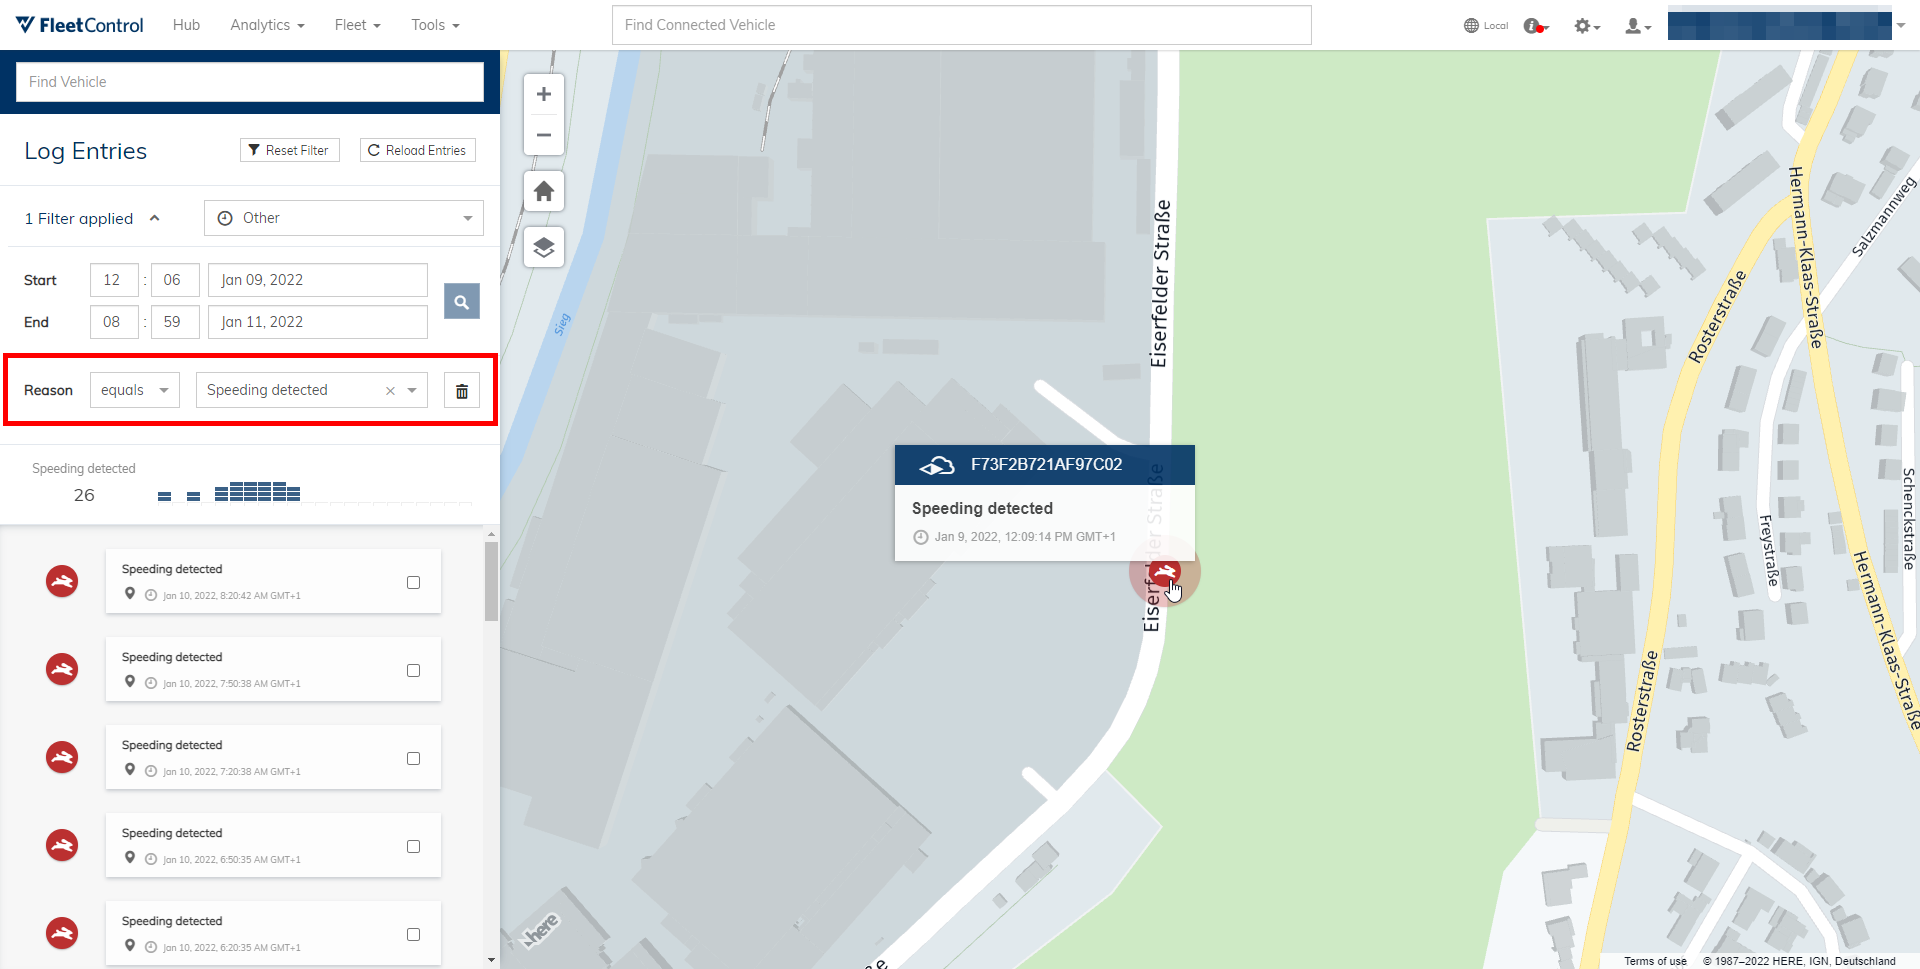
Opening the detailed view for a speeding event shows by how much the speed limit was exceeded. The speed threshold is a configurable number up to which traveling faster than the speed limit is tolerated. Speeding events are only created once it is exceeded. In the example below, the speed threshold is 15km/h, so the speeding event was only created once the vehicle traveled faster than the legal speed limit plus this threshold. In this case, 17km/h.
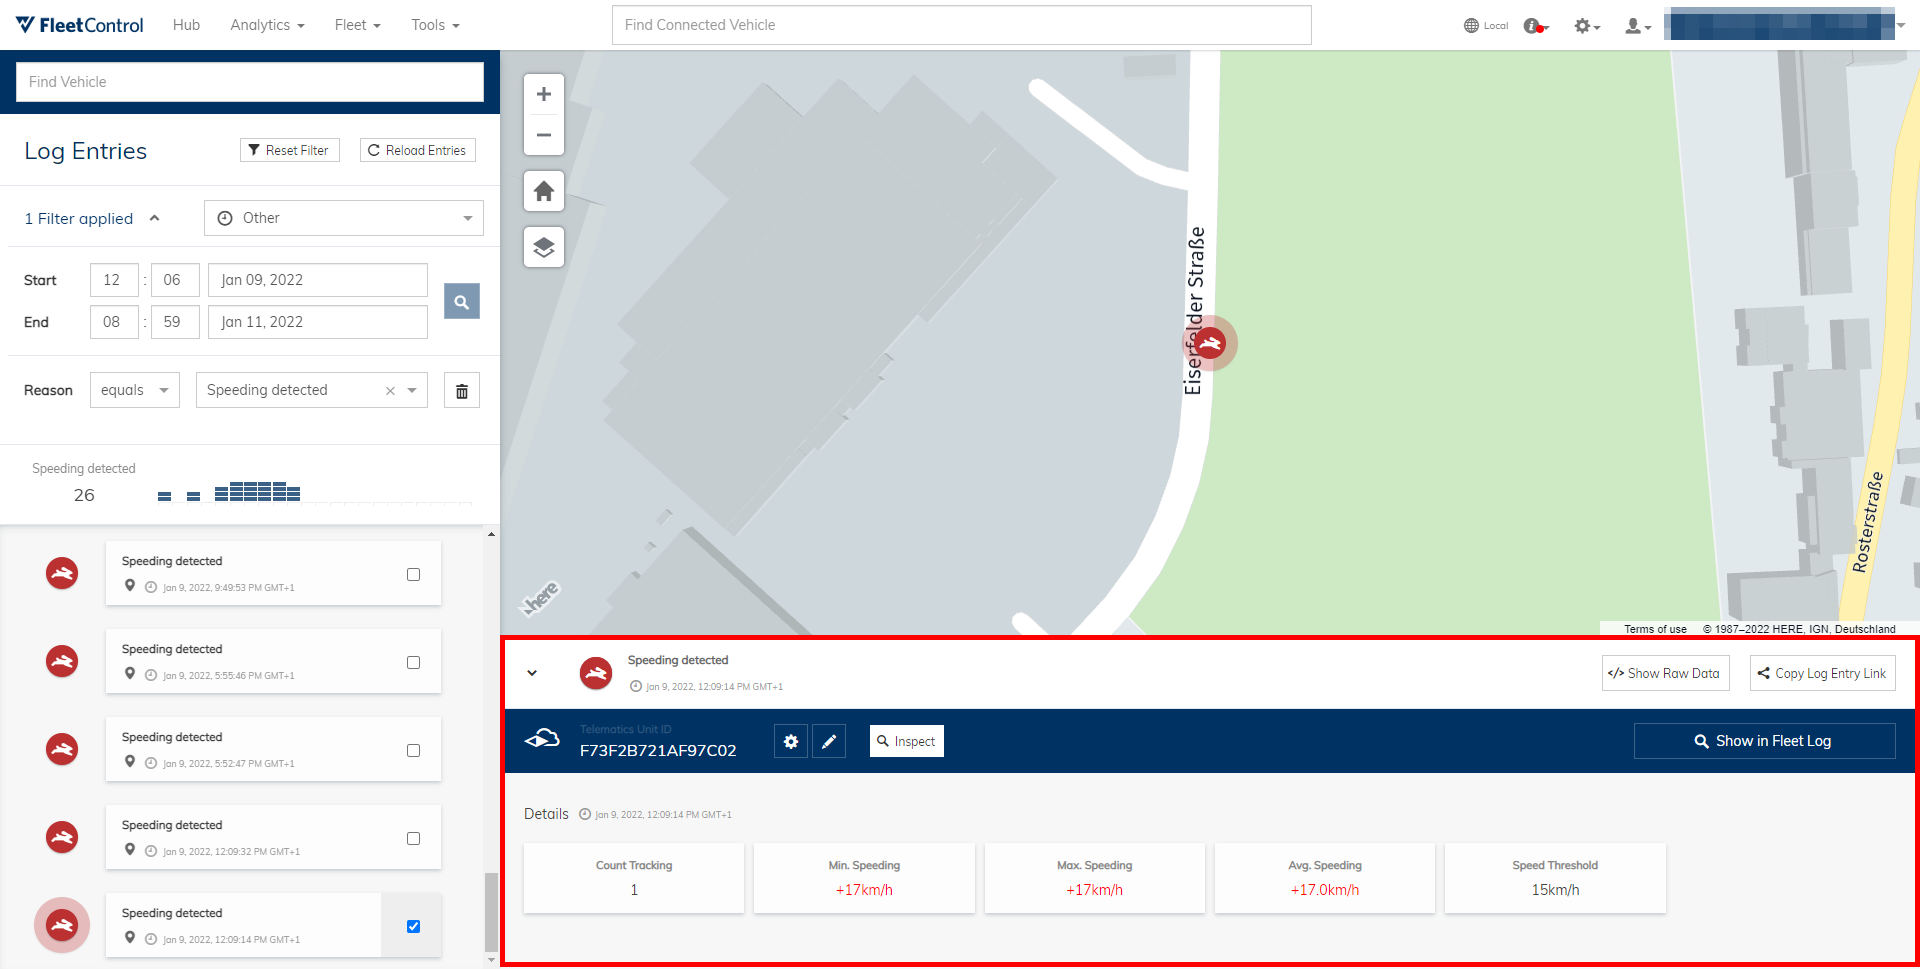
Selecting Show in Fleet Log loads events of the associated trip in which the speeding event was created. Usually, not the entire trip is included at this point, but only events immediately before and after the speeding event. You can click Extend the selected time frame to view the entire trip.
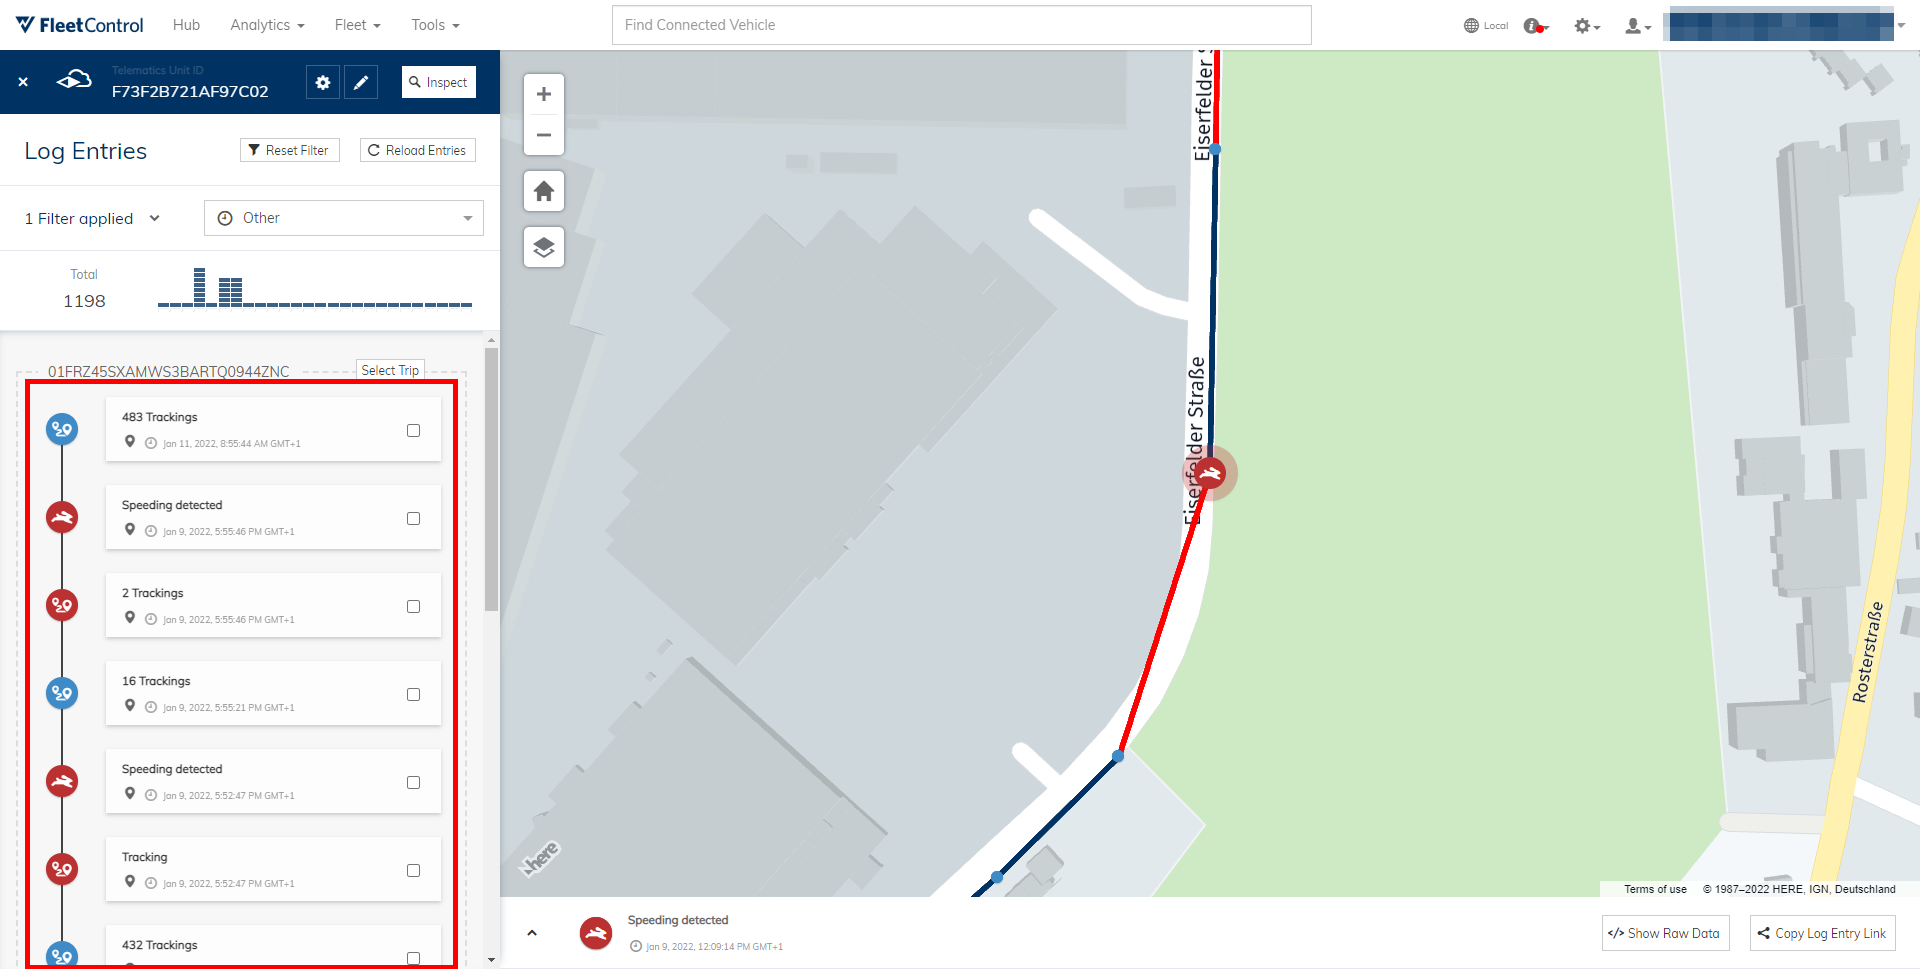
In the trip chronology, normal trackings are separated from trackings in which speeding was detected. In the example above, after 483 trackings without exceeding the speed limit, speeding was detected. For one, the event Speeding detected is created. Immediately after, the trackings in which the legal speed limit was exceeded are marked in red and separated from other trackings. This allows you to easily view the relevant trackings and access important data, such as the traveled speed.
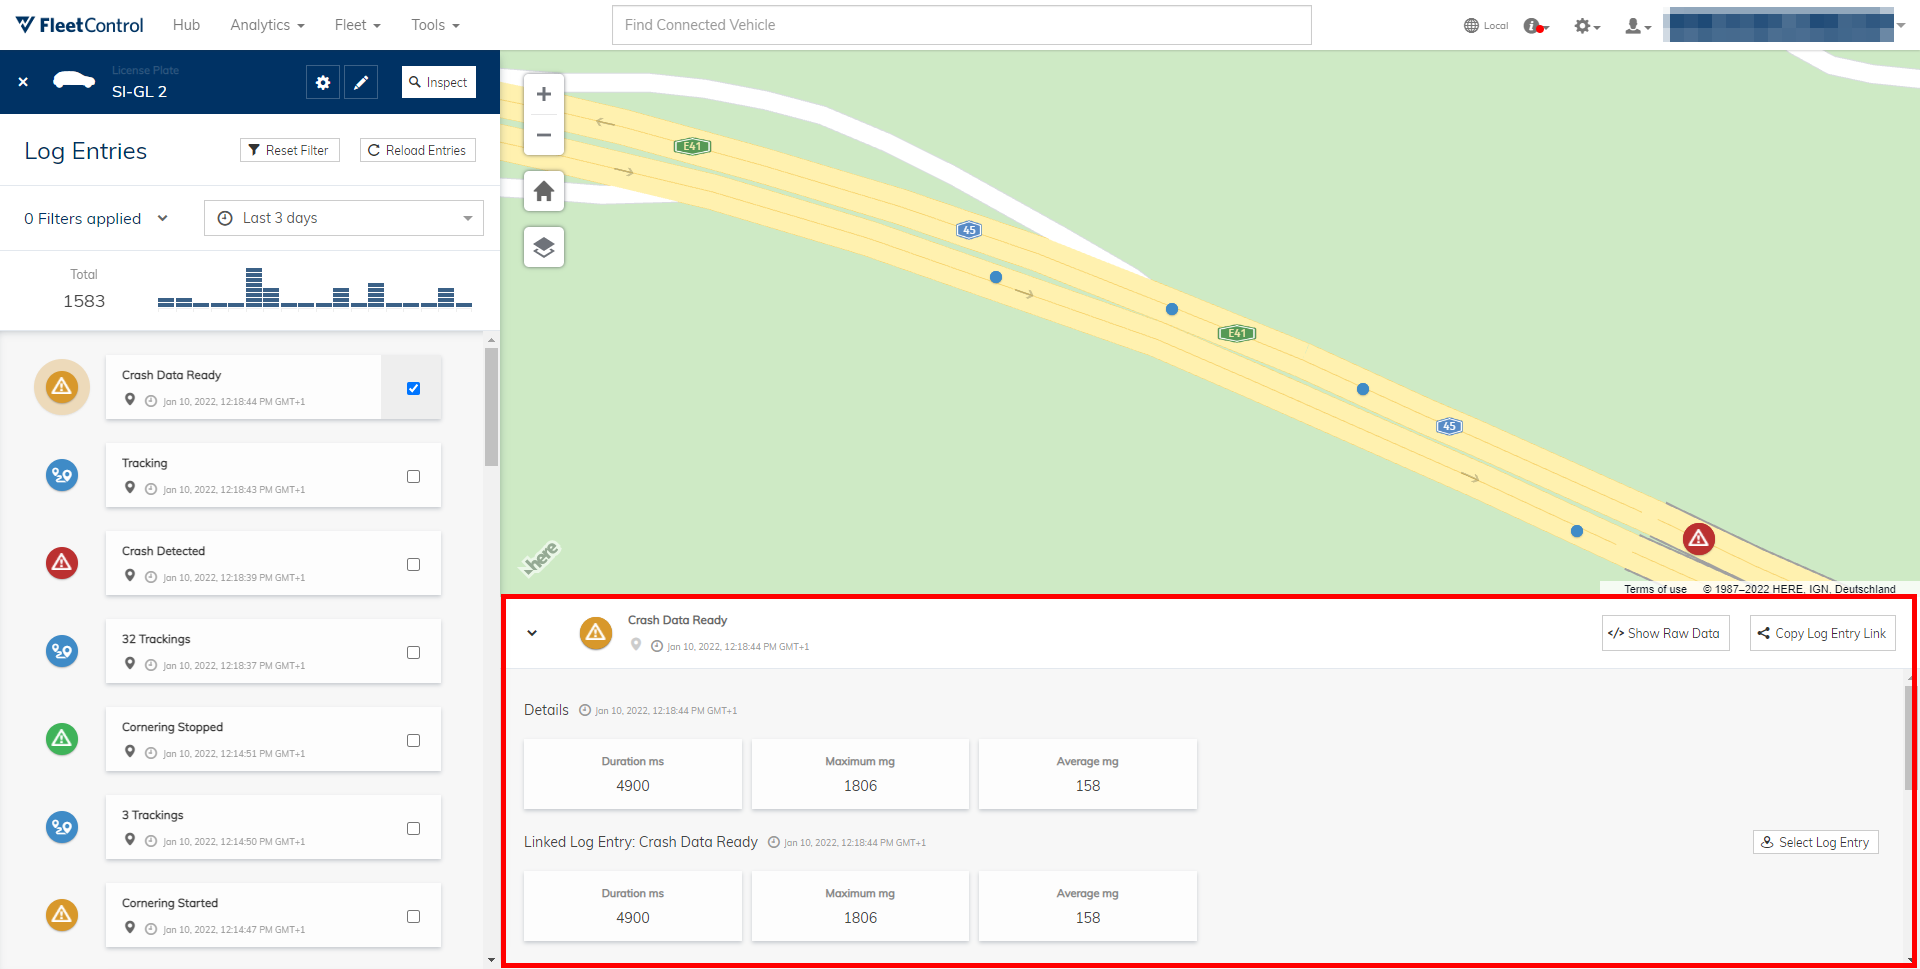
Crashes⚓︎
Crash events are created when the vehicles detects a crash. You can select Crash detected events either from the Multiview or directly from their red map tags.
After you have selected a crash event, you can view detailed information on the bottom of the map view. Also, the associated trip’s events are loaded on the left.
Troubleshooting⚓︎
In case you experience issues using Fleet Log and your problem is listed below, you can try the included solution. Otherwise, contact INVERS Support.
Lag or delays⚓︎
If you have trouble using Fleet Log due to parts of the feature responding slowly or not at all, try reducing the selected time frame. There might be too many events and trackings loaded at once.
Also, you can try accessing Fleet Log from a different web browser.