Connectivity Monitor⚓︎
The connectivity monitor provides a dashboard that allows you to both stay up to date on your fleet’s overall connectivity status and also investigate individual vehicles’ connection states. Currently, the connectivity monitor is available for OneAPI fleets. It is located under Analytics > Connectivity. Note that connectivity data is provided by all CloudBoxxes, but only some OEM telematics.
Overview⚓︎
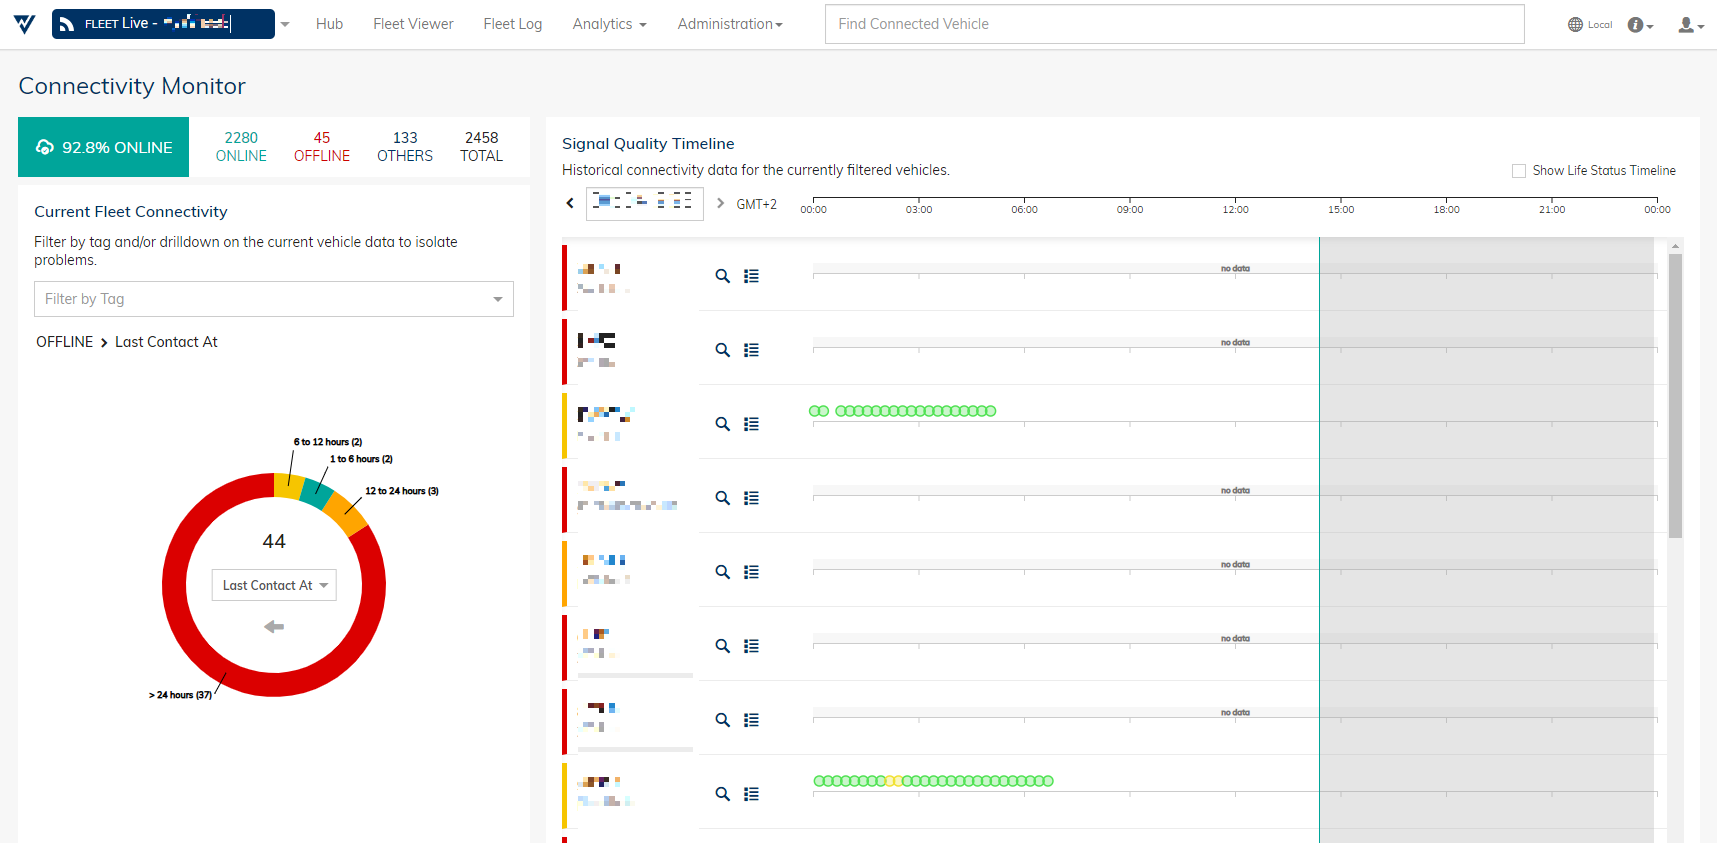
In the top left, the Overview shows a breakdown of your fleet’s current connectivity. Next to the percentage of vehicles that are currently online, you can see the exact number of vehicles that are online and offline. Additionally, vehicles can be assigned to a third category, neither online nor offline. This happens, when FleetControl cannot conclusively determine their connectivity status. This might be due to the vehicle still being setup or missing from the fleet entirely. Finally, the total number of vehicles in your fleet is displayed.
Current fleet connectivity⚓︎
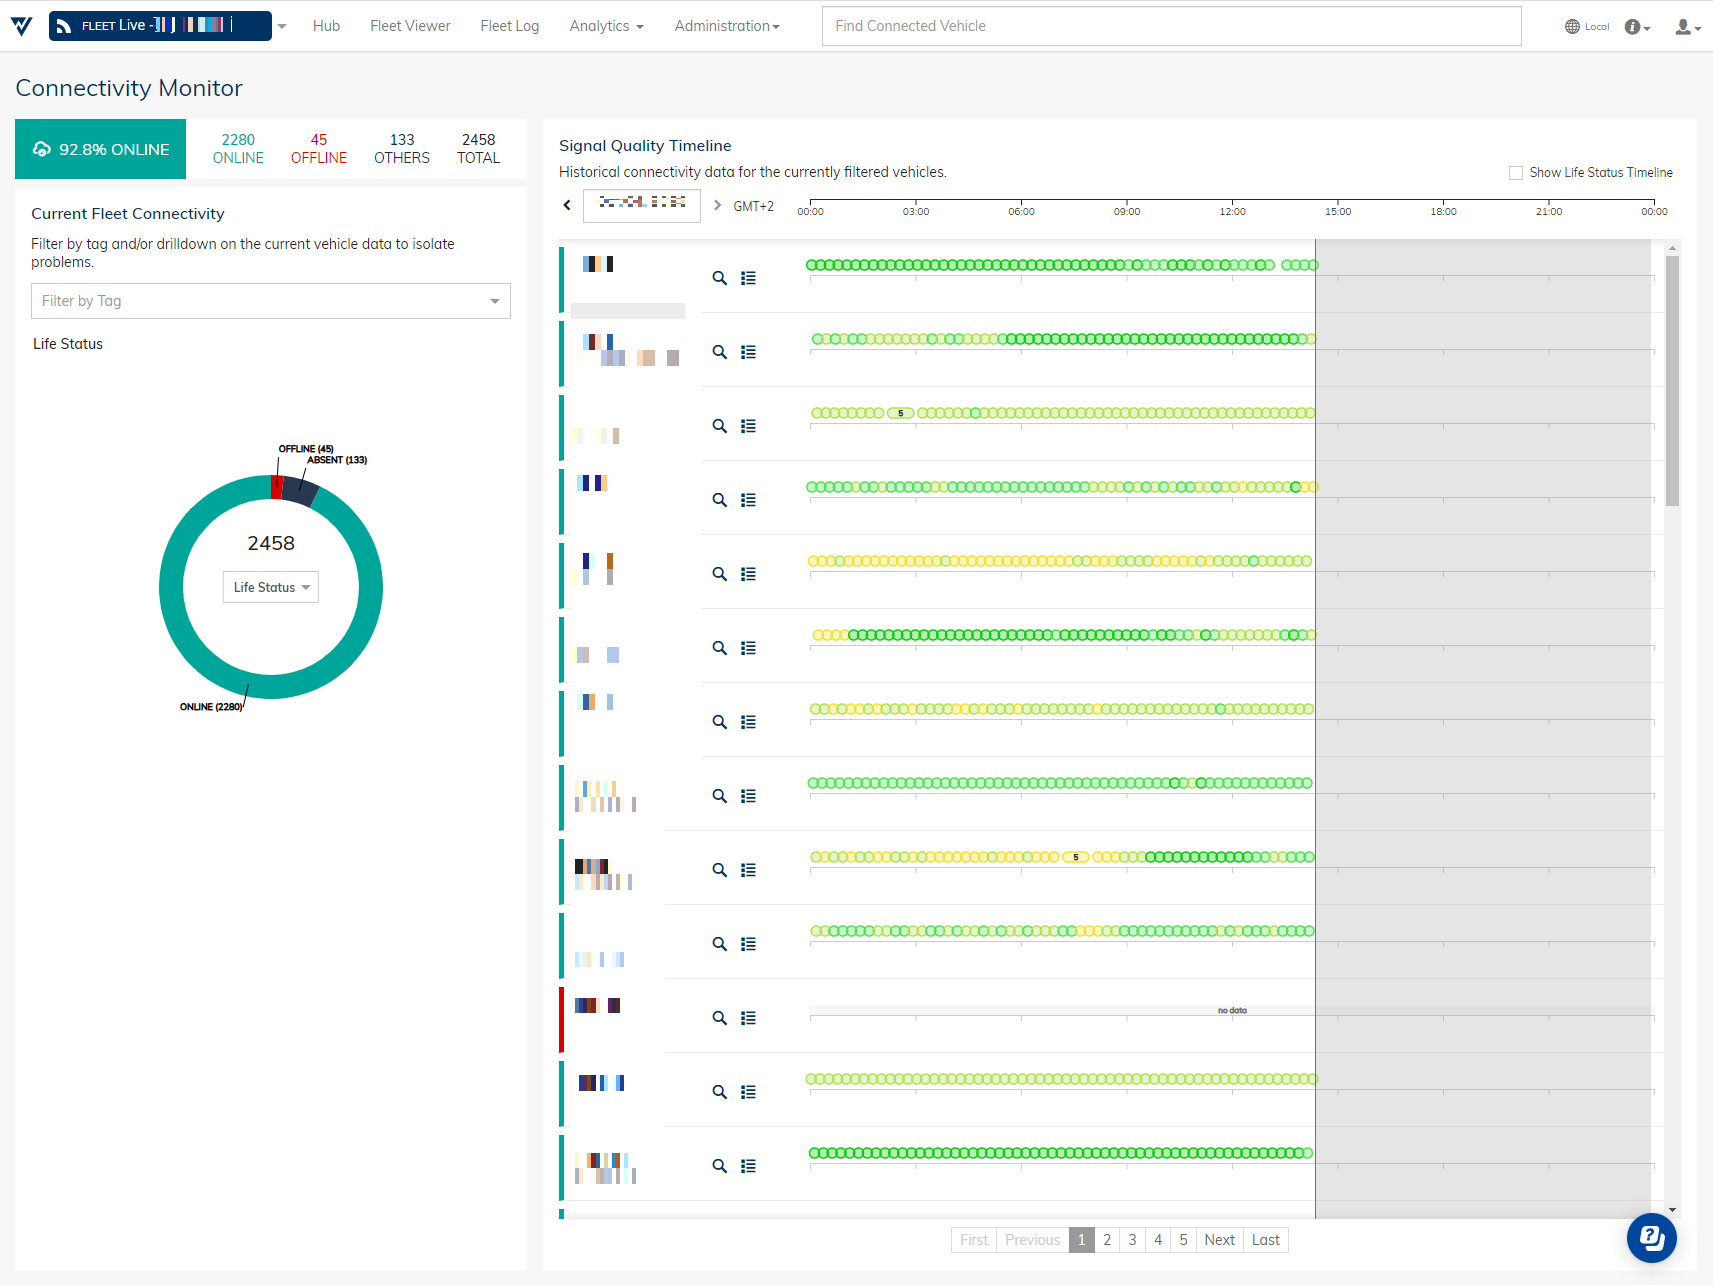
The section below the Overview displays different metrics of your fleet’s current connectivity in a pie chart. Per default, the selected metric is the Life Status of your vehicles. You can change the displayed metric by selecting them from the drop-down menu. You can click individual sections of the pie chart to zoom in on the respective group of vehicles. For example, with the metric Life Status selected, you can click the Offline portion to only investigate vehicles that currently have that status. Then, you can choose a different metric, like Brand from the drop-down menu to apply it to the selected group. Now, you can see of which brand the vehicles that are offline in your fleet are. If you want to go up a level, simply click the arrow to return to the previous chart.
Signal quality timeline⚓︎
The Signal Quality Timeline displays historical connectivity data for all currently selected vehicles. You can adjust the timeframe shown in the top left. Each row corresponds to a single vehicle and you can use the buttons on the left to navigate to the vehicle’s Inspect and Fleet Log page.
If available, the signal quality information from the selected timeframe is displayed for each vehicle. The color of the dots indicates the quality of the vehicle’s connection at that point in time. This allows you to easily spot any periods of bad connectivity.
To filter the vehicles displayed in the Signal Quality Timeline, use the pie chart on the left to filter for certain metrics and states.