Connectivity
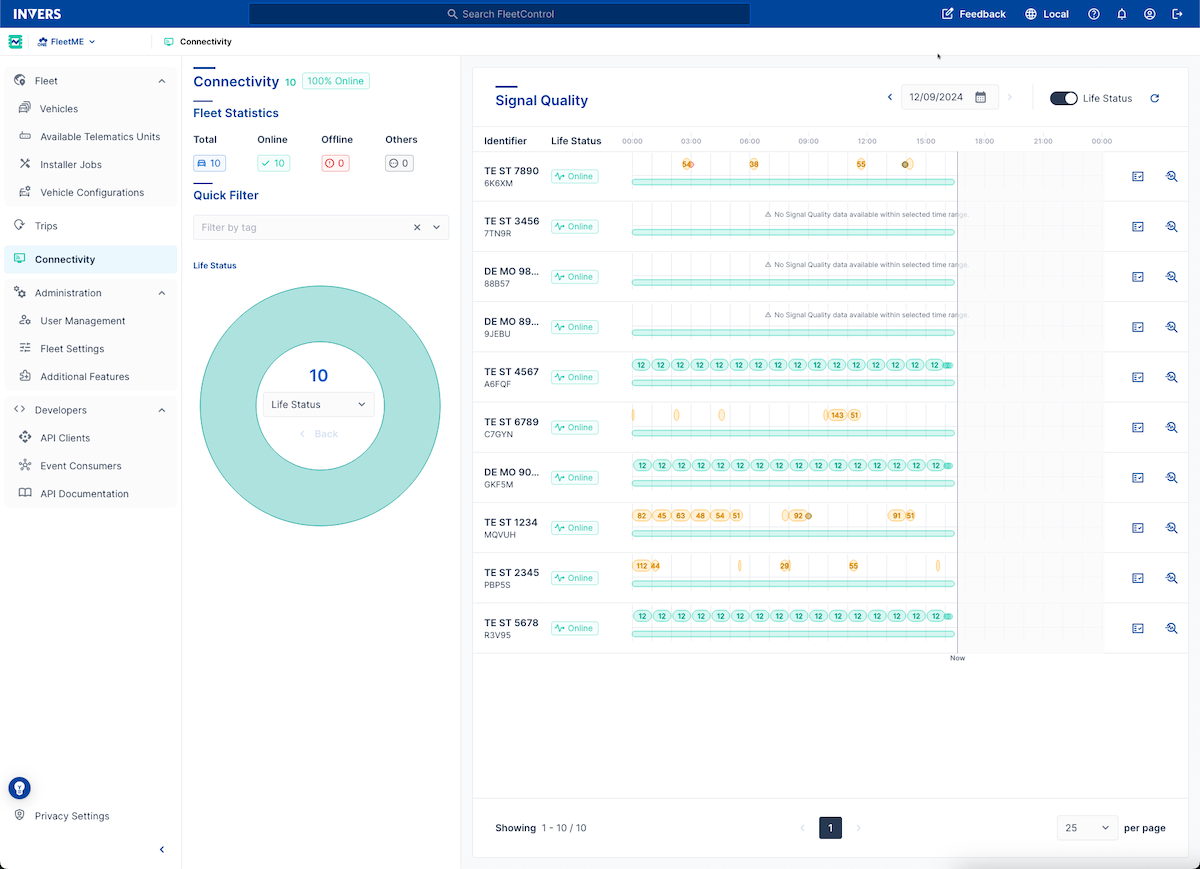
Use the Connectivity dashboard to monitor and analyze your fleet’s connectivity status. Track overall fleet connectivity and individual vehicle connection states.
Open the Connectivity page: Go to Monitoring → Connectivity in the main navigation.

At a Glance⚓︎
- Fleet Statistics — Summary of online, offline, and other vehicle states
- Quick Filter — Filter by tag and drill into connectivity metrics
- Signal Quality — Historical signal quality graph per vehicle
Fleet Statistics⚓︎

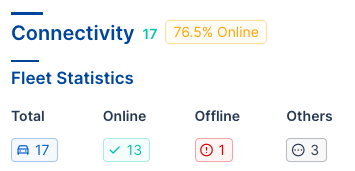
The Fleet Statistics section, located in the top left, provides a breakdown of your fleet’s current connectivity:
- Total — The total number of vehicles in your fleet
- Online — The percentage and number of vehicles currently online
- Offline — The number of vehicles offline
- Others — Vehicles that are absent, disappeared, or in setup
Quick Filter⚓︎

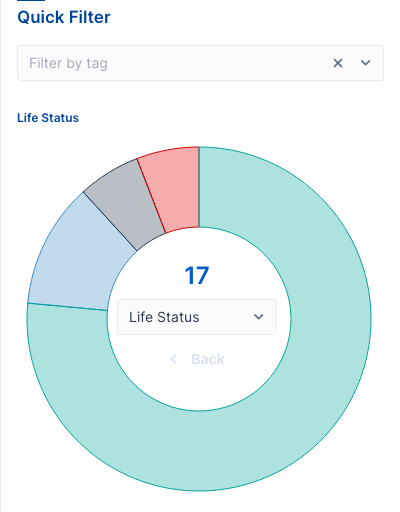
Use the Filter by tag dropdown to find vehicles with specific tags.
The pie chart displays different metrics of your fleet’s current connectivity. By default, the chart shows the Life Status of your vehicles. Change the displayed metric by selecting an option from the dropdown in the middle of the pie chart.
Drilling Into Data⚓︎
Select individual sections of the pie chart to zoom in on a specific group of vehicles:
- With the Life Status metric selected, select the Offline portion to investigate only offline vehicles.
- Choose a different metric, like Vehicle Brand, from the dropdown to apply it to the selected group.
- The chart displays the brand distribution of the offline vehicles in your fleet.
- To return to the previous level, select Back.
Signal Quality⚓︎

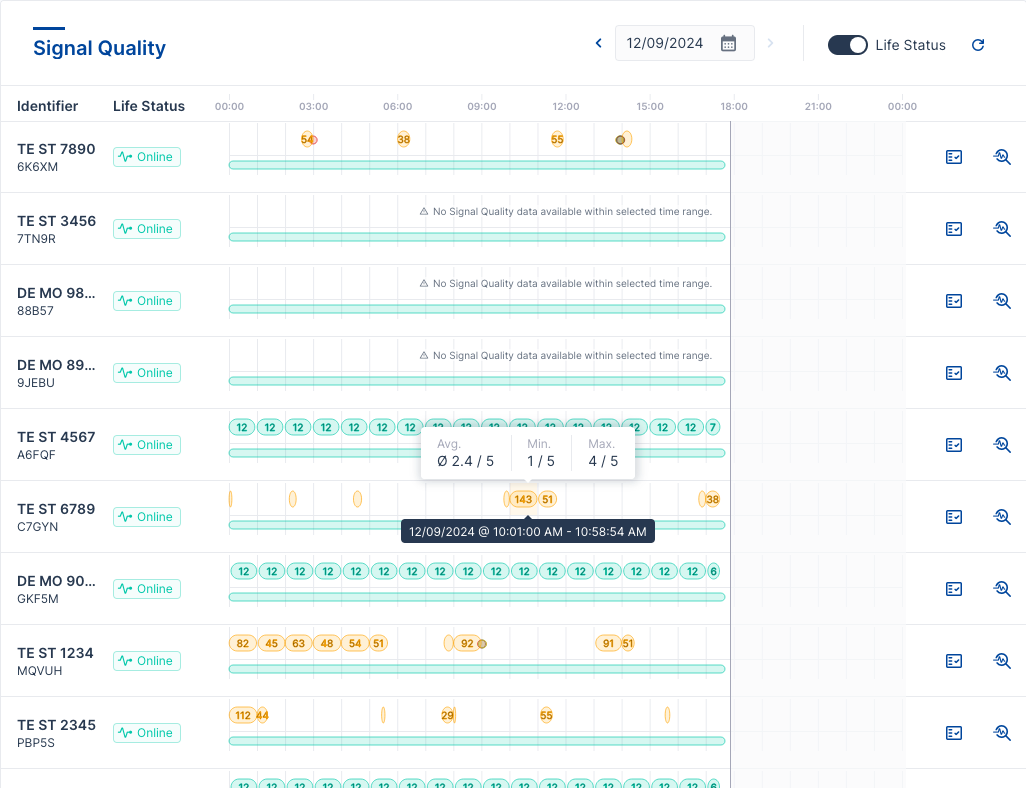
The table displays the Signal Quality graph for each filtered vehicle over the selected time range. Hover over the bars and bubbles to see details like average, minimum, and maximum signal quality.
Navigation:
- Select a date or use the back and forward arrow icons to scroll through the days
- Select the Refresh button to update data for the current day
Actions:
Related Articles⚓︎
- User Interface — Common controls and navigation
- Vehicles — Vehicle table and management
- Inspect — Vehicle details and diagnostics
- Events — Vehicle event timeline